DEC GOLD
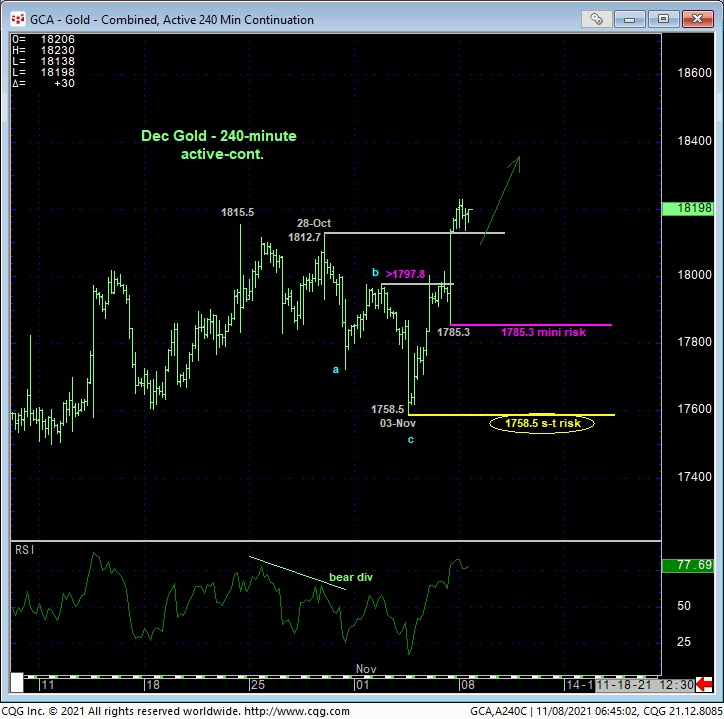
In Thur’s technical Webcast we discussed that day’s recovery above 02-Nov’s 1797.8 high that exposed the recent sell-off attempt from 28-Oct’s 1812.7 high to 03-Nov’s 1758.5 low as a 3-wave and thus corrective affair as labeled in the 240-min chart below. Fri’s break above 1812.7 confirmed this count and leaves smaller-degree corrective lows in its wake at 1785.3 and 1758.5 that this market is now required to fail below to defer or threaten a broader bullish count. Until and unless such weakness is proven, further and possibly accelerated gains straight away are expected. Per such, these levels represent our new mini and smaller-degree risk parameters from which shorter-term traders with tighter risk profiles can once again try rebasing and managing the risk of a resumed or continued bullish policy and exposure.
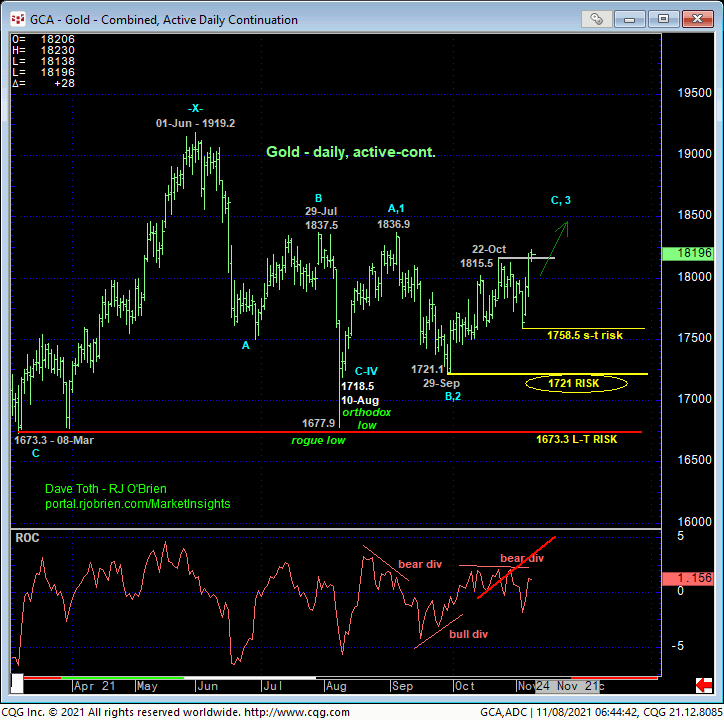
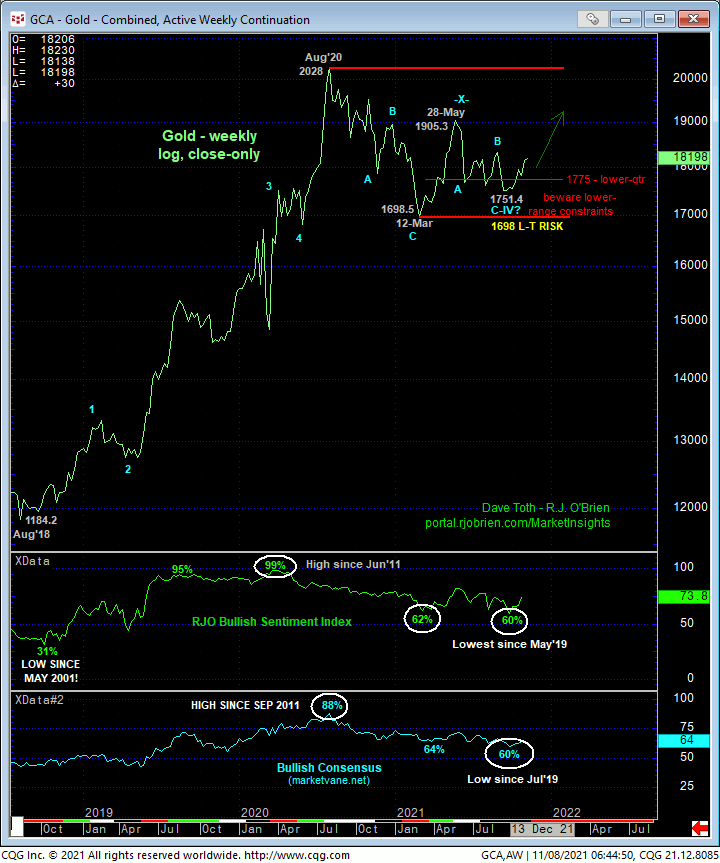
Stepping back, only a glance at the daily chart above is needed to see how volatile, erratic and challenging the past FOUR MONTHS’ price action has been. The fact that this price action stems from the lower-quarter of the past 15-month range however remains consistent with our very long-term bullish count that contends that the price action from Aug’20’s all-time high is merely corrective/consolidative ahead of an eventual resumption of the secular bull trend that preceded it. To negate this long-term bullish count, the market, quite simply, needs to break the 1673-area (1698 on a weekly close basis) that has supported it all year.
These issues considered, a continued or resumed bullish policy and exposure are advised with a failure below at least last week’s 1758.5 low required to defer or threaten this call enough to warrant paring or neutralizing exposure. Very short-term traders can use 1785.3 as a tight bull risk parameter. In lieu of such weakness, further and possibly accelerated gains straight away are expected, with a clear break above the 1837-area that provided resistance between Jul and Sep exposing a run at all-time highs.
DEC SILVER
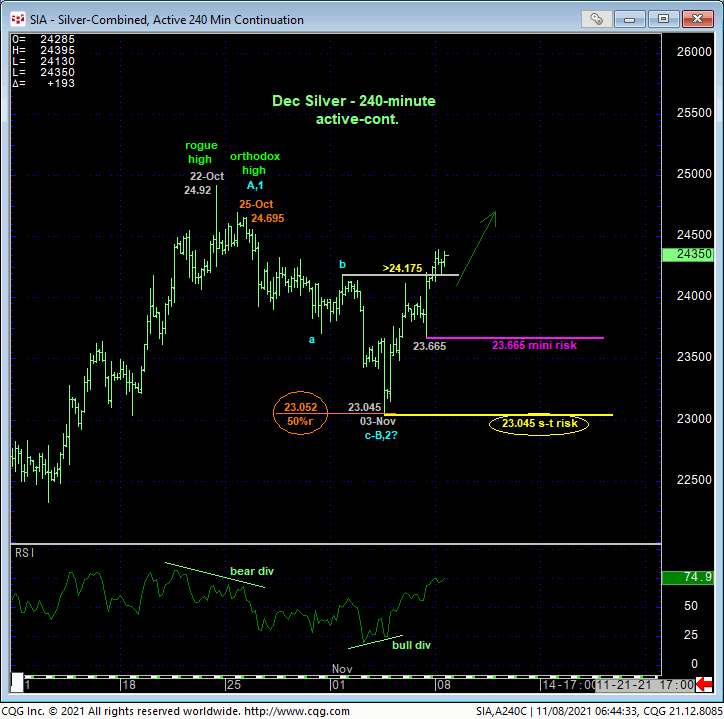
Similarly, Fri’s recovery above 01-Nov’s 24.175 high and our short-term risk parameter renders late-Oct/early-Nov’s sell-off attempt from 24.695 to 23.045 a 3-wave affair as labeled in the 240-min chart below. Left unaltered by a relapse below 23.045, this 3-wave setback is considered a corrective affair that warns of a resumption of Oct’s uptrend that preceded it to new highs above 24.695, reinforcing our long-term bullish count.
This short-term intermediate-term strength also leaves Fri’s 23.665 low in its wake as a smaller-degree corrective low that shorter-term traders with tighter risk profiles can also use as a mini risk parameter from which to rebase and manage the risk of a bullish policy and exposure.
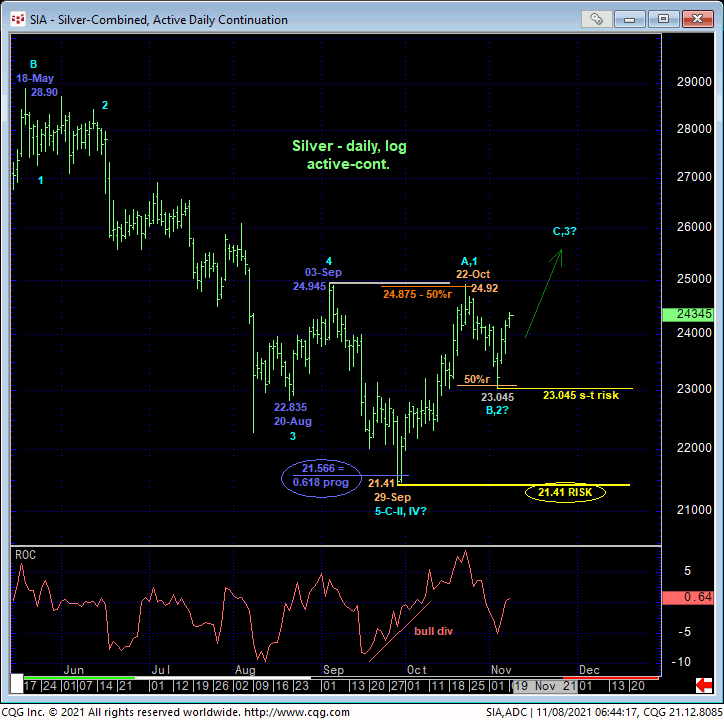
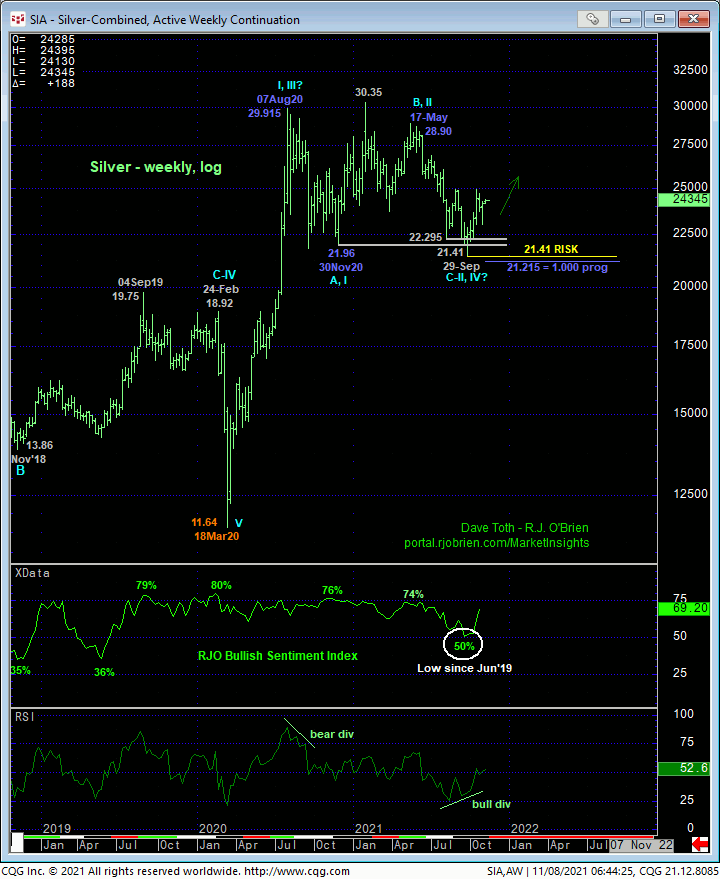
From a longer-term perspective, the price action from 29-Sep’s 21.41 low is shaping up to be some of the most compelling across all commodity sectors given:
- the market’s gross failure to sustain Sep’s break below Nov’20’s 21.96 low
- the clear 3-wave and thus corrective sell-off attempt from Aug’20’s 29.915 high
- bullish divergence in WEEKLY momentum
- recent 2-year low of 50% in our RJO Bullish Sentiment Index
- textbook complete 5-wave Elliott sequence down from 18-May’s 28.90 high to 29-Sep’s 21.41 low
- impulsive (A- or 1st-Wave) counter-trend rally from 21.41 to 22-Oct’s 24.92 high followed by a
- 3-wave (thus far at least) and thus corrective relapse attempt that stalled within a dime of the
- (23.052) 50% retrace of the 21.41 – 24.695 rally.
This is an extraordinarily compelling list of base/reversal-threat elements that, if correct, warns of a resumption of the secular bull trend to eventual new highs above the 30.00-area. A relapse below at least 23.045 is required to defer or threaten this call while commensurately larger-degree weakness below 29-Sep’s 21.41 low is required to negate it. These issues considered, a bullish policy remains advised for long-term institutional players with a failure below 23.045 required to pare exposure to more conservative levels and commensurately larger-degree weakness below 21.41 to negate the call altogether and warrant neutralizing remaining exposure. Shorter-term traders with tighter risk profiles are advised to first approach setbacks to suspected support around the 24.175-area as corrective buying opportunities with weakness below 23.665 and/or 23.045 required to pare or neutralize exposure. In lieu of at least such weakness, further and possibly accelerated gains should not surprise.
