APR GOLD
Today’s nondescript slip below 21-Feb’s 1323.3 low detailed in the 240-min chart below confirms a bearish divergence in very short-term momentum that leaves Fri’s 1335.6 high in its wake as the latest smaller-degree corrective high in its wake as the level this market must now recoup to render the relapse from 20-Feb’s 1349.8 high a 3-wave and thus corrective affair consistent with our broader bullish count. In lieu of such 1335.6+ gains and for reasons we’ll discuss below, today’s break could be the next reinforcing evidence of a correction or reversal lower that could be major in scope. In this regard this 1335.6 high is considered our new short-term risk parameter from which non-bullish decisions like long-covers and new bearish punts can be objectively based and managed.
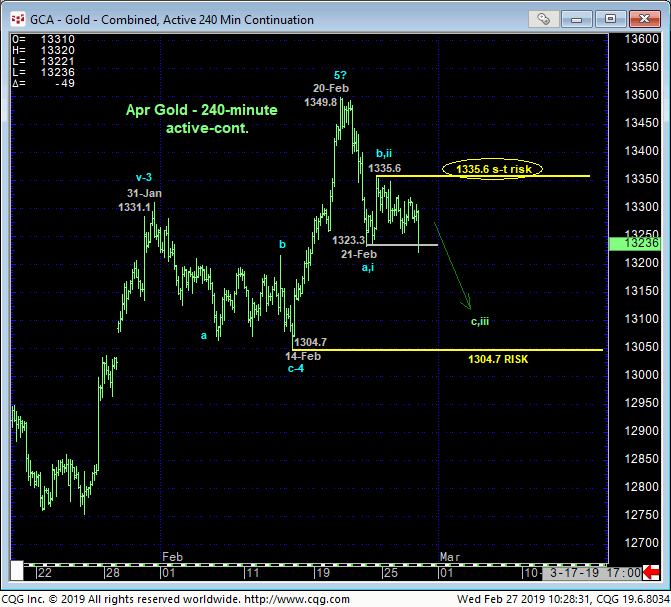
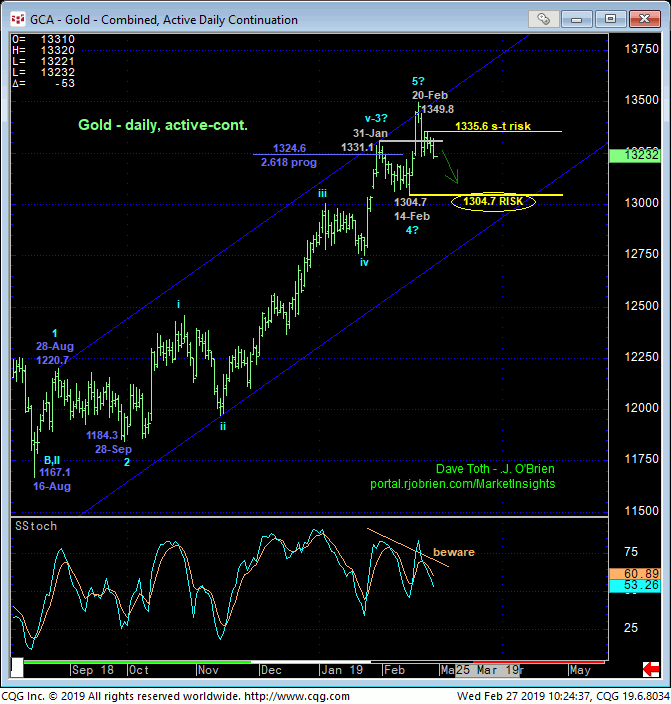
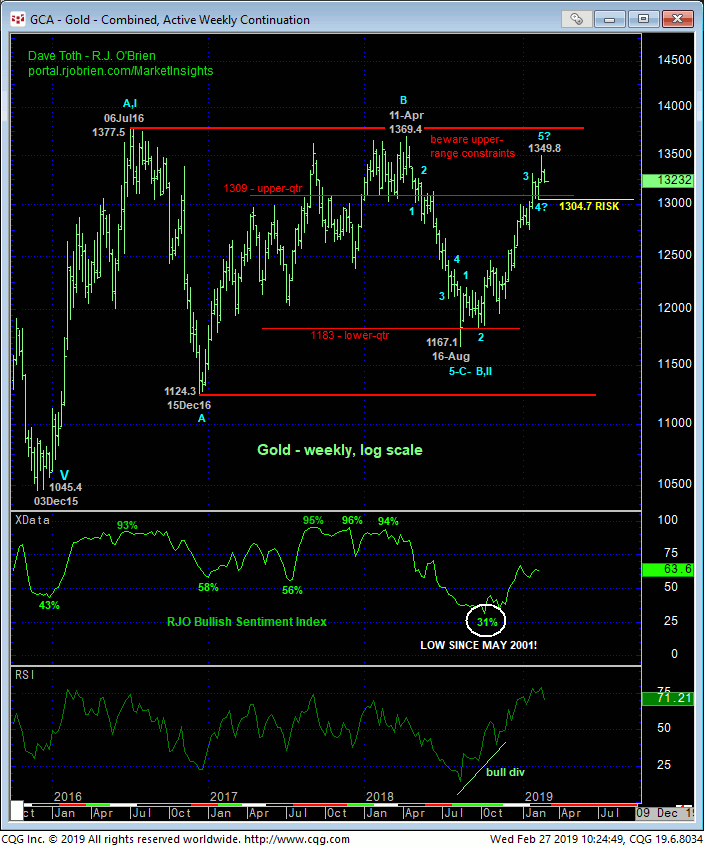
Today’s admittedly minor display of weakness takes on added importance against a broader peak/reversal-threat backdrop stemming from:
- the market’s proximity to the upper-quarter of the multi-year range
- the developing potential for a bearish divergence in daily momentum (confirmed below 14-Feb’s 1304.7 larger-degree corrective low and key risk parameter) and
- an arguably complete 5-wave Elliott sequence dating from last Aug’s 1167.1 low as labeled in the both the daily chart above and weekly log chart below.
Left unaltered by a recovery above at least 1335.6 and preferably last week’s 1349.8 high, we believe there’s a growing threat of a major correction lower that could span weeks or even months.
These issues considered, traders are advised to pare or neutralize bullish exposure commensurate with their personal risk profiles with a recovery above 1335.6 minimally required to mitigate this threat and subsequent weakness below 1304.7 confirming this count and exposing potentially extensive losses thereafter.
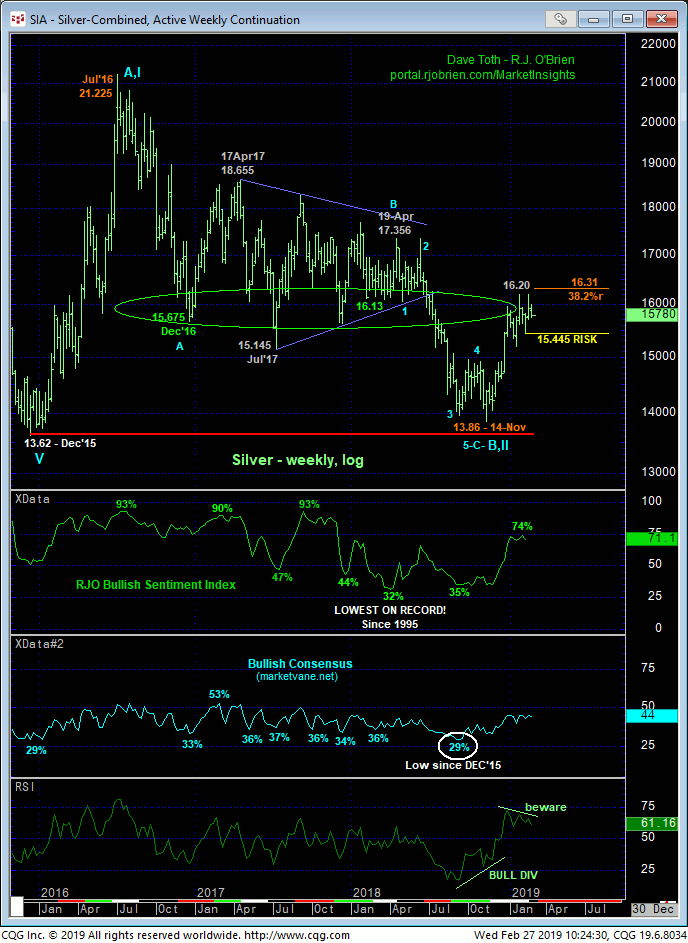
MAY SILVER
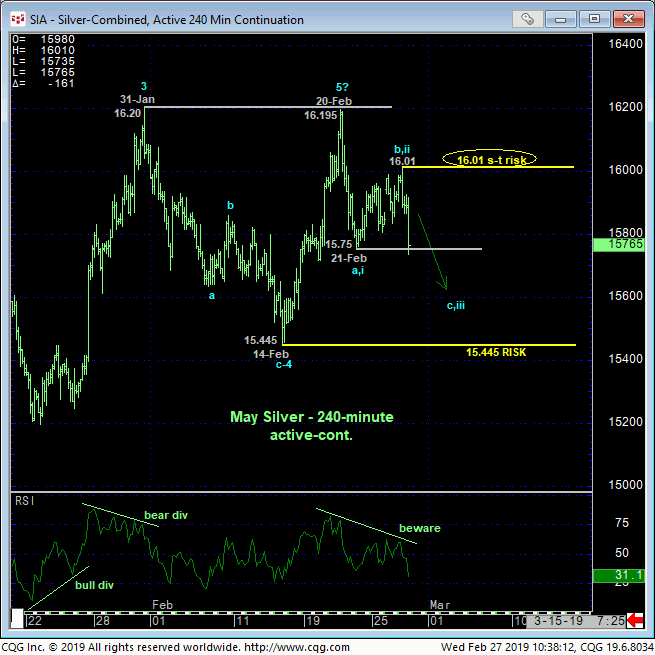
The technical construct and expectations for the silver market are almost identical to those detailed above in gold following this morning’s failure below 21-Feb’s 15.75 low. This confirms a bearish divergence in short-term momentum that defines 20-Feb’s 16.195 high as one of developing importance and possibly the END of a 5-wave Elliott sequence from 14Nov18’s 13.86 low as labeled in the daily chart below. While commensurately larger-degree weakness below 14-Feb’s 15.445 next larger-degree corrective low remains required to CONFIRM this divergence to the point of non-bullish action by long-term players, the market’s proximity to a potentially huge resistance candidate around the 16-handle forebodes a more significant relapse.
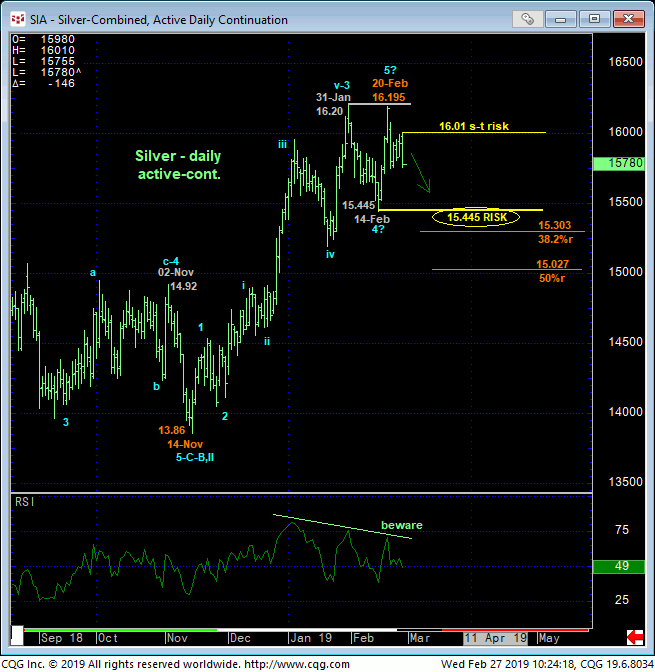
The weekly log chart below shows the huge former support from the 16-handle-area starting from Dec’16 until Jul’18’s breakdown left it a huge resistance candidate. Combined with waning momentum on a WEEKLY basis, the 5-wave Elliott sequence up and a returned to a relatively frothy 74% reading in our RJO Bullish Sentiment Index, we believe current conditions are ripe for a broader peak/correction/reversal of Nov-Feb’s entire 13.86 – 16.195 rally.
These issues considered, traders are advised to move to a neutral-to-cautiously-bearish policy from current 15.76-area levels OB with a recovery above at least 16.01 required to negate this specific call and warrant its cover. In lieu of such strength further and possibly protracted losses should not surprise in the days, weeks and even months ahead.
