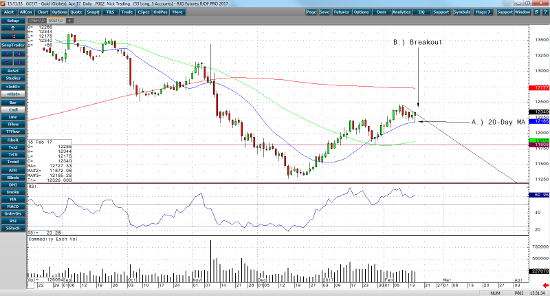
In the early morning trade, April gold was very weak and looking like it was going to sell off down to $1,200.0 an ounce. However, gold has been in a very strong uptrend over the last two months and the gold bulls bought aggressively, and gold ended up $8 for the session. Furthermore, this morning’s CPI numbers reported stronger inflationary numbers than originally expected, which brought more gold bulls into the market. Any signs of inflation will continue to provide support for gold.
If you take a look at the daily gold chart, you’ll clearly see that it bounced off the 20-day moving average this morning, which showed strong support. If the gold market can break above $1,237.0 an ounce, then look for a rally up to its 200-day moving average that currently reads $1,272.7. All technical levels are below on our RJO Pro daily April gold chart.


