Posted on Sep 15, 2022, 07:45 by Dave Toth
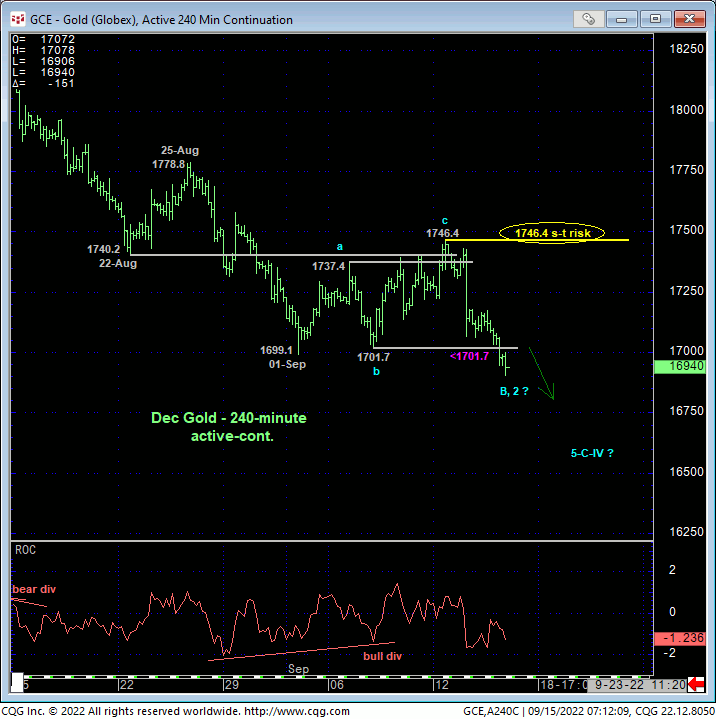
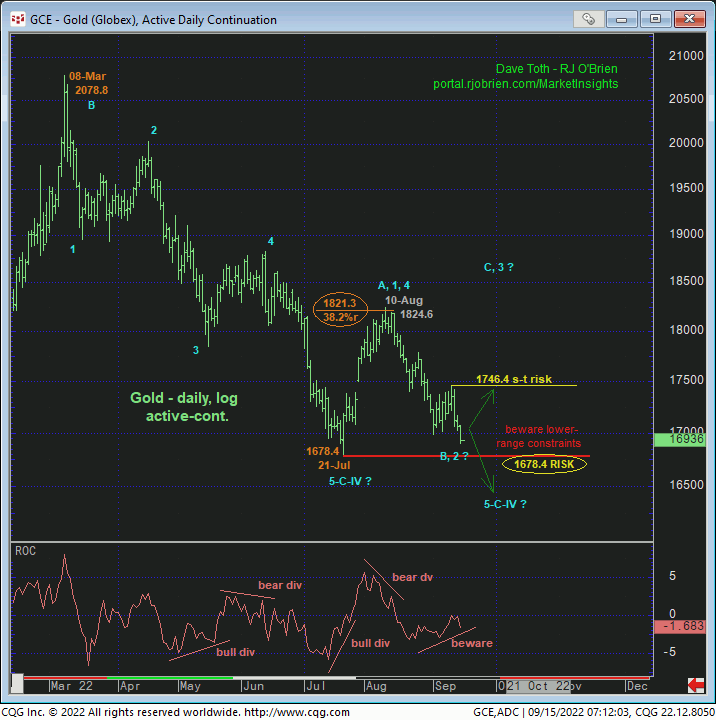
Overnight’s relapse below last week’s 1701.7 low and our mini bull risk parameter negates our short-term bullish count discussed in Mon’s Technical Blog and leaves the market at a pivotal crossroads that could have long-term implications. First of all and from a short-term perspective, this week’s relapse obviously renders the recovery attempt from 01-Sep’s 1699.1 low another 3-wave and thus corrective affair that reaffirms the downtrend from 10-Aug’s 1824.6 high. The resulting by-product of this continued weakness is the market’s definition of Mon’s 1746.4 high as the latest smaller-degree corrective high this market is now required to recoup to arrest the past month’s relapse and resurrect a broader base/reversal count. Until and unless such strength is proven, it’s easy to see in the daily log chart below that this market is spittin’ distance from 21-Jul’s 1678.4 low, the break of which will not only reinstates this year’s major downtrend, but also resurrect the past 25-MONTH peak/correction/reversal threat that could have massive downside consequences.
Mon’s 1746.4 corrective high is a smaller-degree corrective high and “short-term” risk parameter. But for week-ending reasons we discuss below, the market’s ability to recover above 1746.4 in the period immediately ahead is crucial to any longer-term bullish construct. Clearly, a break below 1678.4 must be taken as another indication of this market’s weakness, vulnerability and total dependency on its inverse relationship with the USD rather than as any quality-flight and/or inflation-countering vehicle.
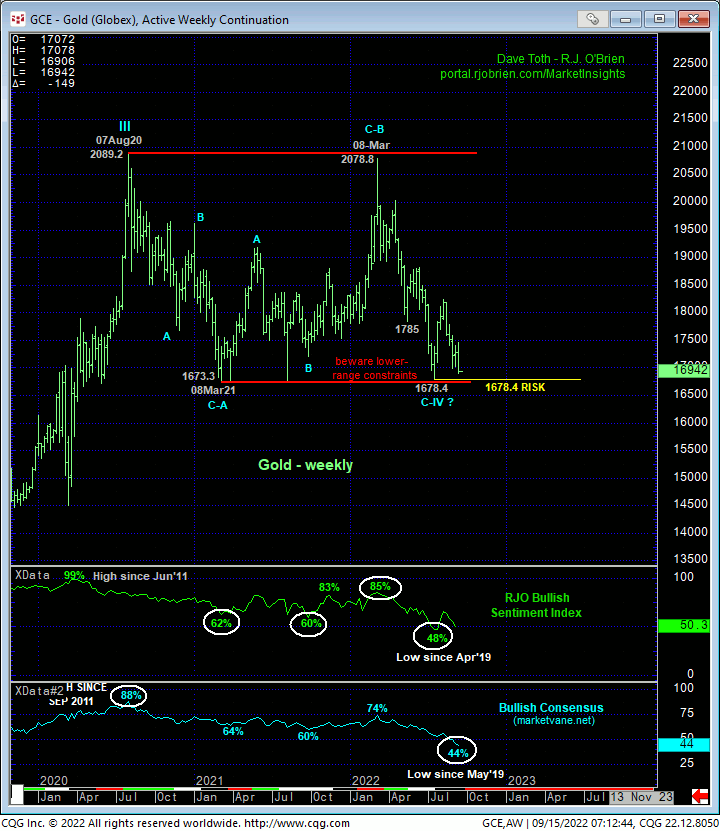
The weekly high-low chart above shows the magnitude of the 1678-to-1673-area that has supported this market for the past two years. As we’ll discuss below, this thus-far-mere-lateral price action from Aug’20’s 2089 high still falls within the bounds of a major but mere (4th-Wave) correction within a secular BULL market. A break below 1673 won’t necessarily negate this long-term bullish count, but from a technical discipline perspective, we would have to acknowledge and respect the prospect of a dramatic 3rd-Wave down below 1673 as part of a massive, multi-year REVERSAL into a major new bear market.
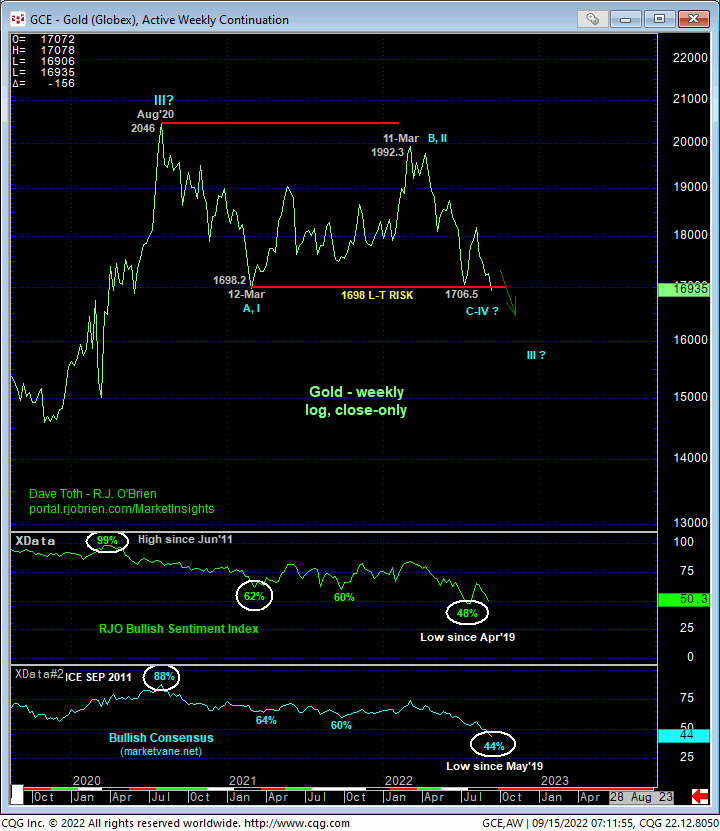
On a weekly log close-only basis below, the market, today, is trading at a new weekly low for the past two years. Herein lies the importance of the market’s ability once again to reject these extreme lower recesses of the two-year range with a bullish divergence in even short-term momentum above Mon’s 1746.4 minor corrective high. If it cannot, but rather closes out this week “down here”, the subsequent extent of this market’s downside vulnerability will have to be approached as indeterminable and potentially severe.
Market sentiment levels, understandably, have returned to historically bearish levels that are typical of major BASE/reversal environments. But sentiment/contrary opinion is not an applicable technical tool in the absence of an accompanying confirmed bullish divergence in momentum. With the market on the cusp of breaking TWO YEAR lows and support, exposing a vast chasm below it totally devoid of any technical levels of merit, this market must absolutely start recovering above levels like 1746.4 and 10-Aug’s 1824.6 larger-degree high to resurrect a reasonable risk/reward policy from the bull side. Below 21-Jul’s 1678.4 low and key long-term bull risk parameter, there is no technical reason to be long gold.
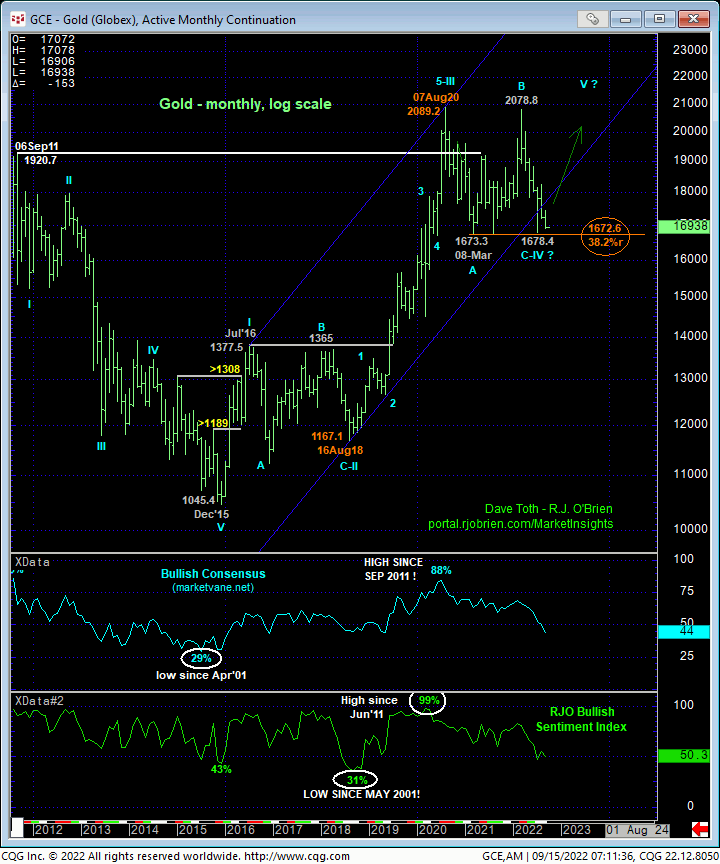
On an even broader monthly log chart below, indeed, the magnitude of Aug’18 – Aug’20’s rally from 1167 to 2089 has “3rd-Wave” written all over it, suggesting that the past two years’ thus-far-mere-lateral chop is a 4th-wave correction ahead of a final 5th-Wave resumption of the SEVEN YEAR secular bull trend from Dec’15’s 1045 low. Again, a break below Mar’21’s 1673 low won’t necessarily negate this long-term bullish count. But it certainly will expose an alternate and major bearish prospect of a 3rd-Wave down of a new and major bear market until and unless arrested by a major bullish divergence in momentum somewhere along the line.
These issues considered, we believe this market has identified 1746.4 and 1678.4 as the key directional triggers heading forward. Traders are advised to toggle directional biases and exposure around these precise levels commensurate with their personal risk profiles.
