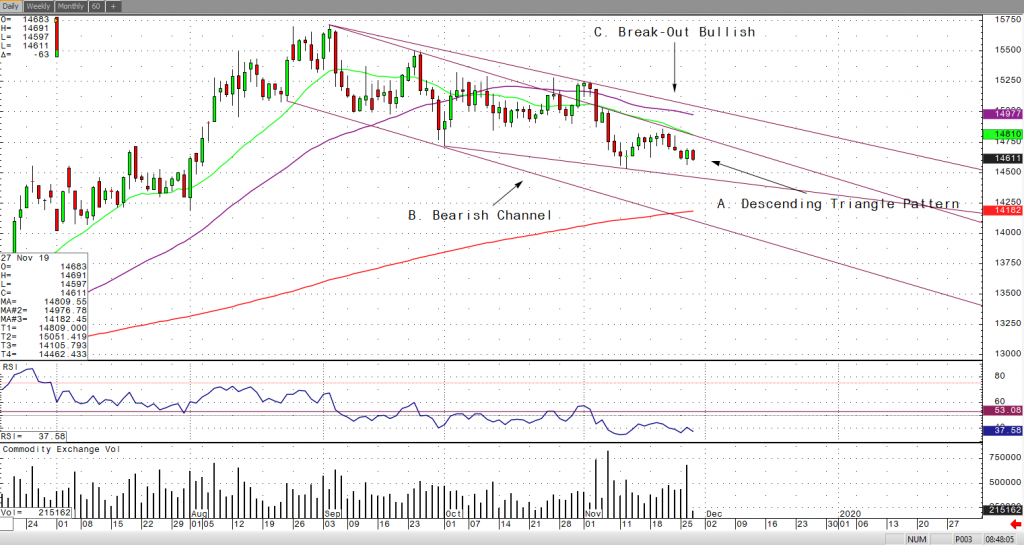
In the early morning trade, February gold has backed off yesterday’s high and is now trading down $6 and currently trading at $1,461. Gold has shown some resilience this week especially with positive economic news and with technically bearish charts. The market has bounced back from last week’s lows even though there have been positive statements this week from both the U.S. and China that they are getting ever so closer to a Phase One Trade Deal agreement. However, with the slight sell off overnight maybe the rally will be short lived as the stock market consistently breaking all-time highs this week, which have caused a shift away from risk on commodities such as the metals. Furthermore, India’s gold prices have gone down for the seven straight trading sessions as gold buyers in that country are yet enticed at these low levels and suggesting maybe they’re still waiting for a further sell-off.
If you look at my daily February gold chart, you might see a lot of lines drawn, so let me highlight them for you. Two things that I’ve spotted and that have piqued my interest are that gold is in a bearish descending triangle pattern and at the same time is in a bearish channel. These are two very important bearish patterns that now gives a greater probability of gold trading to lower levels and gives the bear camp a clear edge. For the gold bulls, if you see gold trade above the descending triangle and bearish channel, then the shiny one has a chance of rallying back up to contract highs, but that is roughly around $1,500 a troy ounce. I have highlighted these levels below on my RJO Pro daily February gold chart.


