In the early morning trade, gold has extended on its rally which started last week at $1,555 and is currently trading at $1,579, which is up 1.5% in a week. Obviously, the coronavirus is the driving force of the recent gold rally while it provides fear and concern in the metals and interest rate sectors, which has caused buying from investors/traders alike. Also, the shiny one has expectations that China will eventually release a massive stimulus package after the virus subdues. Furthermore, ETFs saw a 17th straight day of inflow.
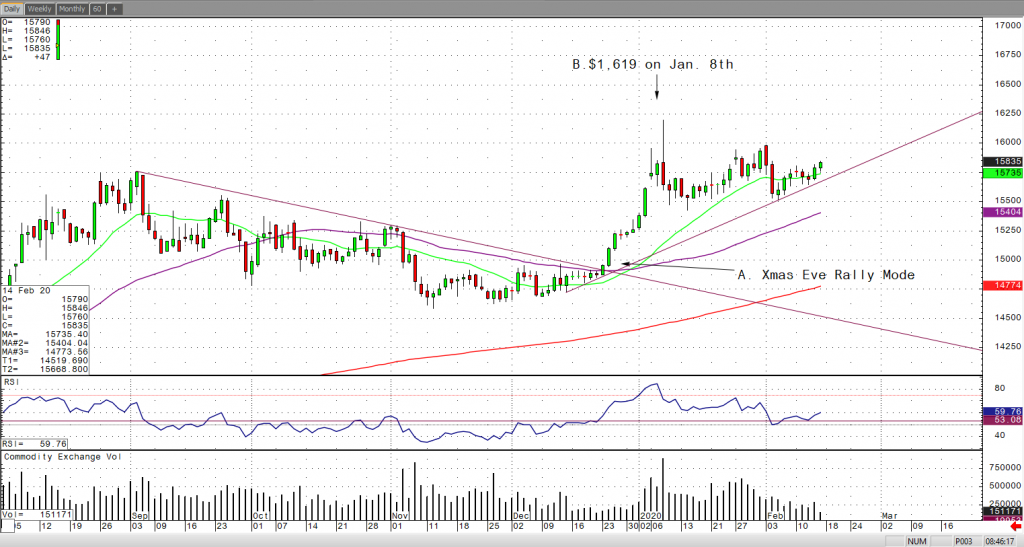
If you take a look at the April gold chart, you’ll clearly see that the gold bulls have taken over on Christmas Eve and have been in control ever since. It is in a strong bull trend and looks like it wants to retest the contract high of $1619.6 which was made back on January 8th. I have highlighted these levels below on my RJO Pro daily April gold candle stick chart.