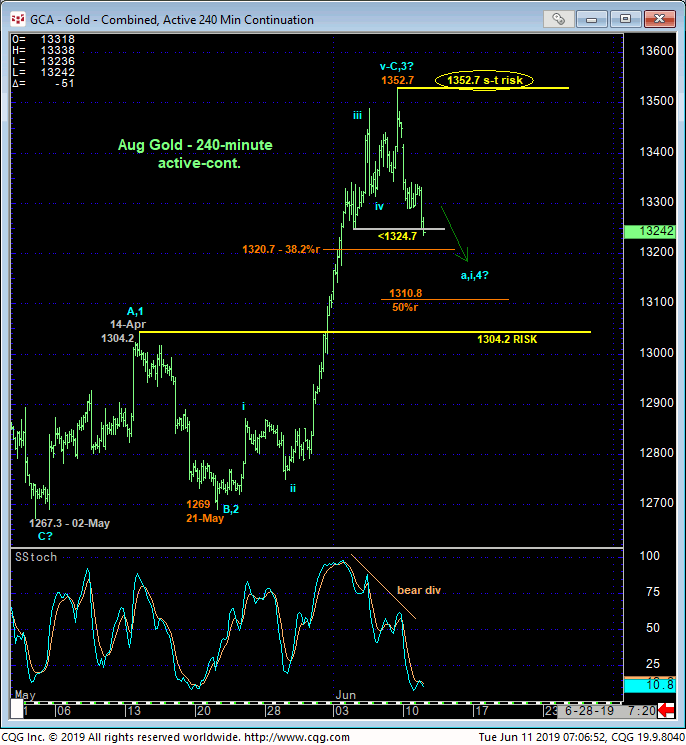
The market’s failure this morning below 04-Jun’s 1324.7 corrective low and our short-term risk parameter discussed in 05-Jun’s Technical Blog confirms a bearish divergence in short-term momentum shown in the 240-min chart below. This momentum failure defines Fri’s 1352.7 high as the end of what looks to be a textbook 5-wave Elliott sequence up from 21-May’s 1269 low and exposes at least a correction of this portion of the 10-month uptrend that dates from Aug’18’s 1167.1 low. But given the market’s proximity to the extreme upper recesses of a major lateral range that has dominated price action for the past three years, the prospect of a more protracted decline cannot be ignored. As a result of this combination of factors, Fri’s 1352.7 high serves as our new short-term but important risk parameter from which non-bullish decisions like long-covers and cautious bearish punts can now be objectively based and managed.

Given the extent and impulsiveness of the rally from 02-May’s 1267.3 low however, we likewise cannot ignore the ultimately bullish prospect that this relapse is just a (4th-Wave) correction within a still-developing broader uptrend. Commensurately larger-degree weakness below 14-May’s (prospective 1st-Wave) high at 1304.2 is required to jeopardize the impulsive integrity of such a broader bullish count, render the recovery from 1267.3 a 3-wave and thus corrective affair and resurrect a broader peak/correction/reversal threat from 20-Feb’s 1349.8 high that could expose at least a run at 02-May’s 1267.3 low and possibly more extensive losses. In effect, we believe the market has identified 1352.7 and 1304.2 as the key directional triggers heading forward.

The weekly log chart below shows the magnitude of the multi-year lateral range capped by the 1352-to-1377-range resistance. This area repelled the impressive rally from last Aug in mid-Feb and, as a result of today’s bearish divergence in short-term mo, may be exerting this resistance once again, exposing a slippery risk/reward slope for bulls “up here”. And while this market is certainly capable of generating and sustaining much frothier bullish sentiment than the current 76% reading in our RJO Bullish Sentiment Index indicates, this 76% is skewed enough to the bull side to be considered a contributing factor to the peak/reversal threat generated by the momentum failure and upper range factors.
These issues considered, both short- and longer-term traders are advised to move to a neutral/sideline position as a result of the bearish divergence in momentum, the market’s proximity to the upper recesses of a 3-year range and relatively frothy bullish sentiment. IF the market is still positioning for a major multi-year reversal above 1377, then we believe it now has to reinforce such a count with proof of labored, corrective behavior on this sell-off attempt that stalls somewhere north of the 1304-area. In lieu of such proof and especially if the market fails below 1304, its downside correction or reversal potential could be extensive. Needless to say, a recovery above 1352.7 mitigates this peak/correction/reversal threat, reinstates the bull and warns of potentially sharp gains thereafter.


