With only a few days to go until July, the past week revealed little with regards to major currency moves. The US Dollar Index dropped lower initially and then closed higher, but still failed to reach 98.0, and still shows no clear technical longer-term direction.
The US Indices closed lower, but generally stayed within the previous week’s range. There are several technical signs that indicate there may be another volatile week ahead, and there are several potentially high impact news events scheduled for Wednesday.
Covid-19 infections here in the US have spiked dramatically, although the death rate has managed to maintain a lower curve.
The Senate is currently in discussions about the next stimulus package.
As we head into the next week of June 2020, key economic calendar news events to watch out for this week may be:
- CB Consumer Confidence – Tuesday.
- Crude Oil inventories, Employment, Manufacturing and FOMC – Wednesday.
- Non-farm payroll, Unemployment – Thursday.
- Independence Day.
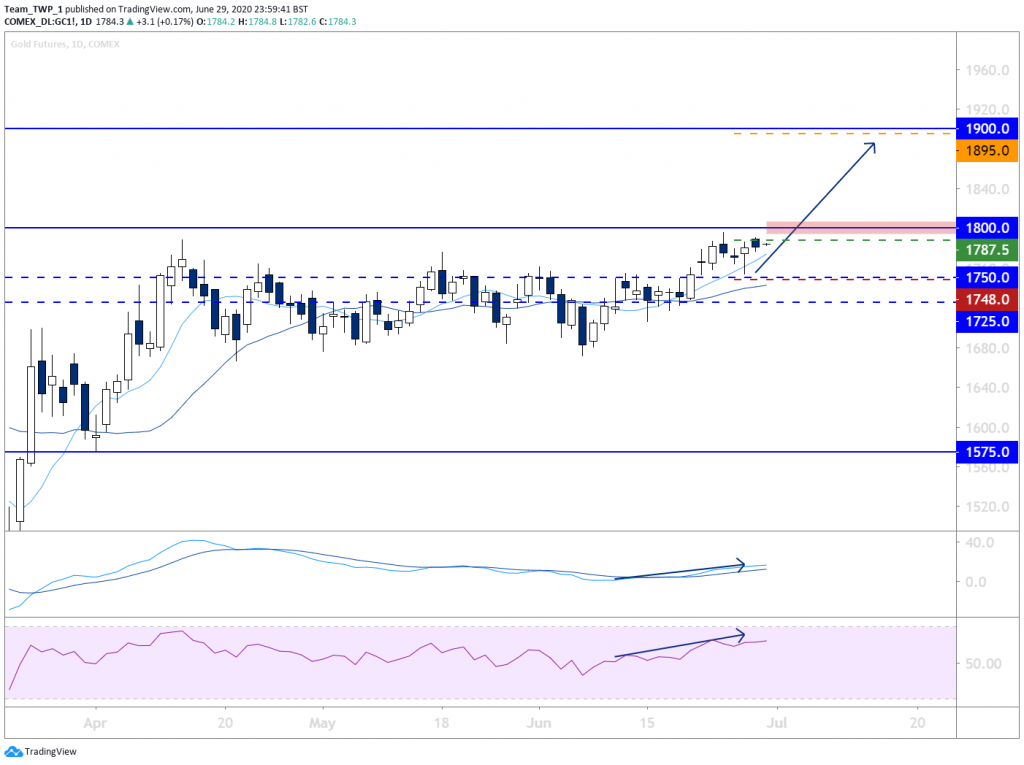
Gold, Daily, Bullish
The monthly, weekly and daily charts are trending up with higher-lows and higher-highs and the momentum indicators are also trending higher.
The 8 & 21 moving averages (MAs) are in the correct order, angle and separation on multiple timeframes.
Price action on the daily chart has recently successfully broken out of a consolidation range and is currently testing the top of the range for support.
A bullish candlestick has formed in the buy zone area of the MAs.
There is a real possibility of resistance at 1,800. Should price subsequently break above the high of the current candle, and break up through 1,800, it may continue up towards the next significant level around 1,900.
An entry above the high of this candle around 1,787.5 could offer an entry into the next leg up, while a stop-loss below the low and/or below the consolidation level around 1,748 could offer decent technical protection.
Traders may consider taking partial profits at a 1:1 target to mitigate risk. 1,895 may be a reasonable target for final profits.
Should price during the next session break the low of the candlestick before breaking the high, the trade becomes invalidated.
Risk management will be key, so a stop-loss is imperative, in order to protect capital exposure against unforeseen outcomes.

E-mini Dow Jones, Daily, Potential Range Breakout
The weekly timeframe displays an uptrend with higher-highs and higher-lows and has also produced a bearish rejection candle.
The daily chart has remained within the previous week’s range and formed a subtle down-trend. The range is between the high of 26,658 and the low of 24,409.
Should price during the next weekly session break the low of the current weekly candlestick (24,409) before breaking the high, price may continue lower towards key support levels and an opportunity may exist to join this move.
An entry below 24409, with a stop-loss either above the range, or behind/above the most recent daily swing-high could offer reasonable stop-loss protection.
The range could alternatively break out to the upside, and therefore an entry above 26,658, with a stop-loss below the range or below the most recent swing-low could offer reasonable stop-loss protection.
The next significant levels to the downside may be 22,000, 21,000 and 18,000, and it may mitigate risk to take partial profits ahead of each of these levels while also employing a trailing stop-loss strategy.
Similarly, entering on a break above 26,658 may have potential to reach 30,000 and partial profits ahead of this significant high could reduce risk further. Risk management will be key, so a stop-loss is imperative, in order to protect capital exposure against unforeseen outcomes.