Posted on Nov 09, 2023, 07:13 by Dave Toth
DEC HEATING OIL
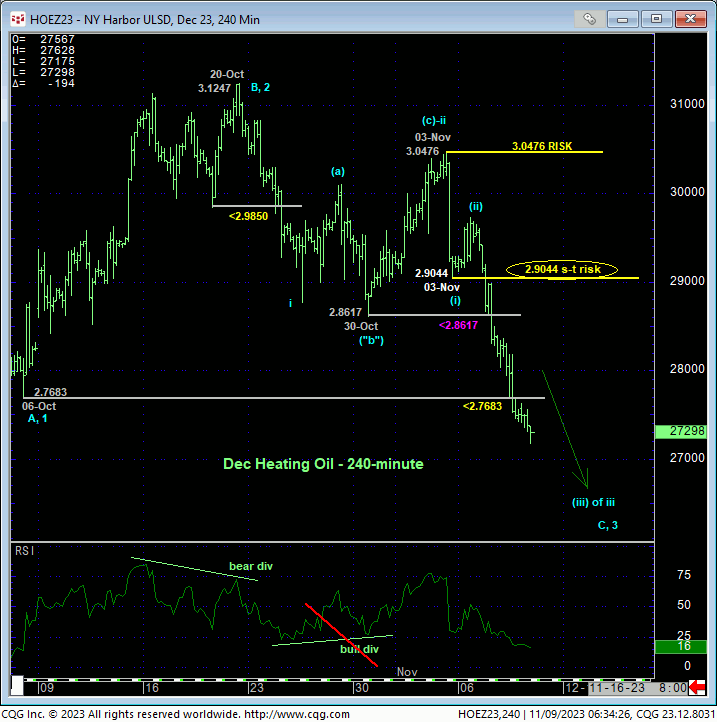
Yesterday’s clear break below 06-Oct’s 2.7683 initial counter-trend low reaffirms our major peak/reversal count introduced in 04-Oct’s Technical Blog and leaves 03-Nov’s 3.0476 high in its wake as the latest key corrective high this market is now required to recover above to negate this call and resurrect a longer-term bullish count. Per such, we’re defining 3.0476 as our new key longer-term risk parameter from which longer-term commercial players can objectively base and manage the risk of a resumed or continued bearish policy and exposure.
On a short-term scale, the past week’s decline from 3.0476 looks to have established a minor 1st-Wave low at 2.9044 on 03-Nov. To maintain the 5-wave impulsive integrity of a more immediate bearish count, this market should not be able to even come close to 2.9044, let alone take it out, so we’re defining this level as our new short-term bear risk parameter pertinent to shorter-term traders with tighter risk profiles.
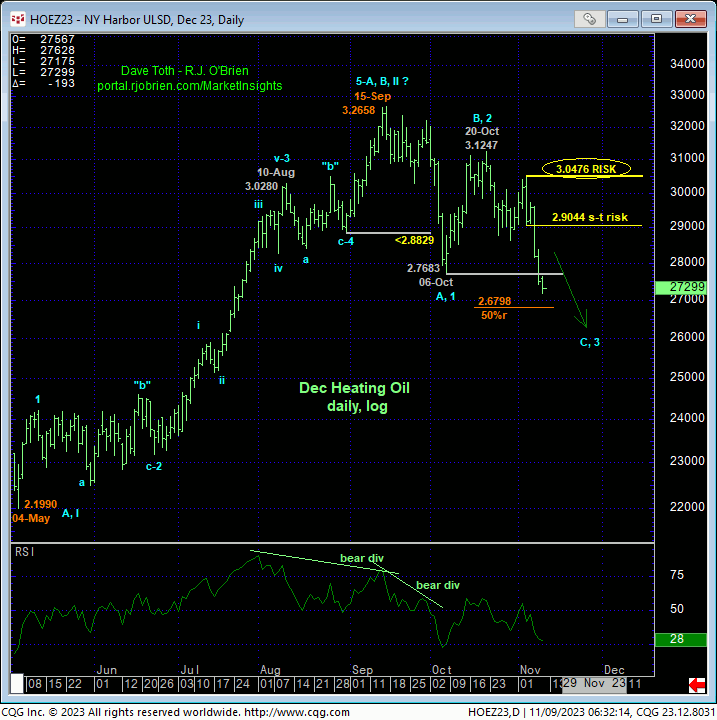
On a broader scale, the daily log chart above shows yesterday’s resumption of Sep-Oct’s initial (A- or 1st-Wave) decline from 15-Sep’s 3.2658 high. The resumed swoon from 20-Oct’s 3.1247 high can be one of only two things:
- the completing C-Wave to a broader BULL market correction or
- the dramatic 3rd-Wave of a major reversal lower.
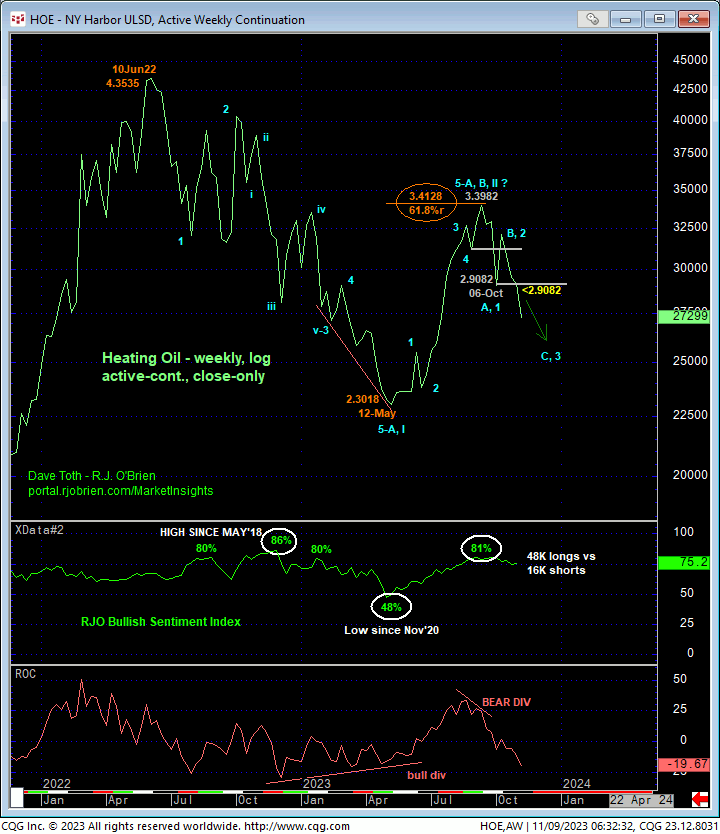
Always biasing towards a wave count that is WITH the trend at hand, and especially given what has been historically high levels in our RJO Bullish Sentiment Index shown in the weekly log close-only chart below, we believe traders should act on the premise that the plunge from 3.1247 is the 3rd-Wave of an eventual 5-wave sequence down that warns of protracted losses that could span weeks if not months.
Indeed, and at a still-frothy 75% reading reflecting 48K Managed Money long positions reportable to the CFTC versus only 16K shorts, plenty of fuel for downside vulnerability remains as the overall market forces the capitulation of this long-&-wrong exposure. Combined with early-Oct’s bearish divergence in WEEKLY momentum, a textbook complete 5-wave Elliott sequence up from 12-May’s 2.3018 low weekly close and the market’s rejection of the (3.4128) 61.8% retrace of Jun’22 – May’23’s entire 4.3535 – 2.3018 decimation, the technical elements typical of major peak/reversal environments remain intact and warn of potentially protracted losses straight away, including a run at this year’s lows around 2.30-to-2.15, and below.
These issues considered, a bearish policy and exposure are advised with recovery attempts to the 2.81-handle-area first approached as corrective selling opportunities with strength above at least 2.9044 required to defer or threaten this call enough to warrant neutralizing exposure. In lieu of such strength, further and possibly accelerated losses that could span weeks or months are anticipated.
DEC RBOB
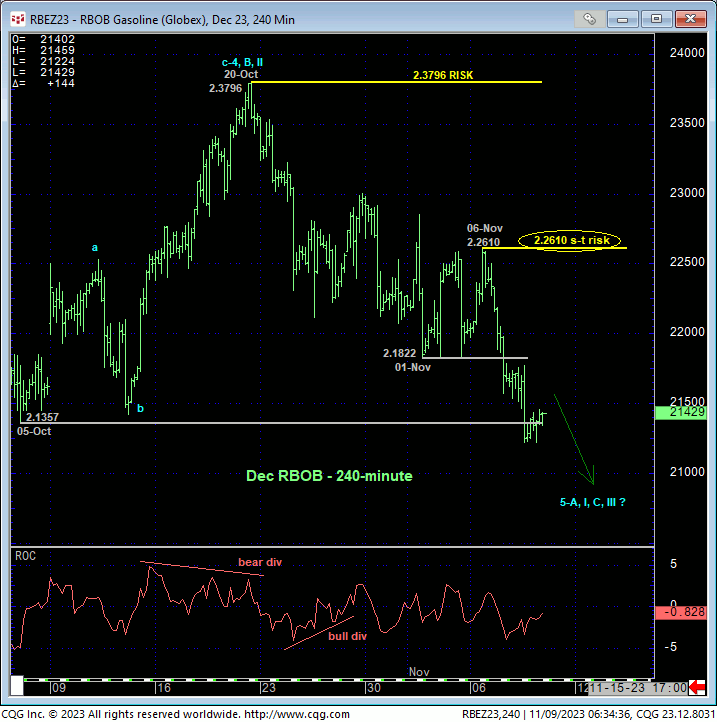
Similarly, yesterday’s break below 05-Oct’s 2.1357 low reaffirms our major peak/reversal count in RBOB introduced in 29-Sep’s Technical Blog and leaves smaller- and larger-degree corrective highs in its wake at 2.2610 and 2.3796 that this market is now required to recover above to negate a count calling for more immediate losses. Per such, these levels serves as our new short- and long-term parameters from which traders can objectively rebase and manage the risk of a continued bearish policy and exposure commensurate with their personal risk profiles.
Former 2.14-to-2.18-handle-area support is considered new near-term resistance.
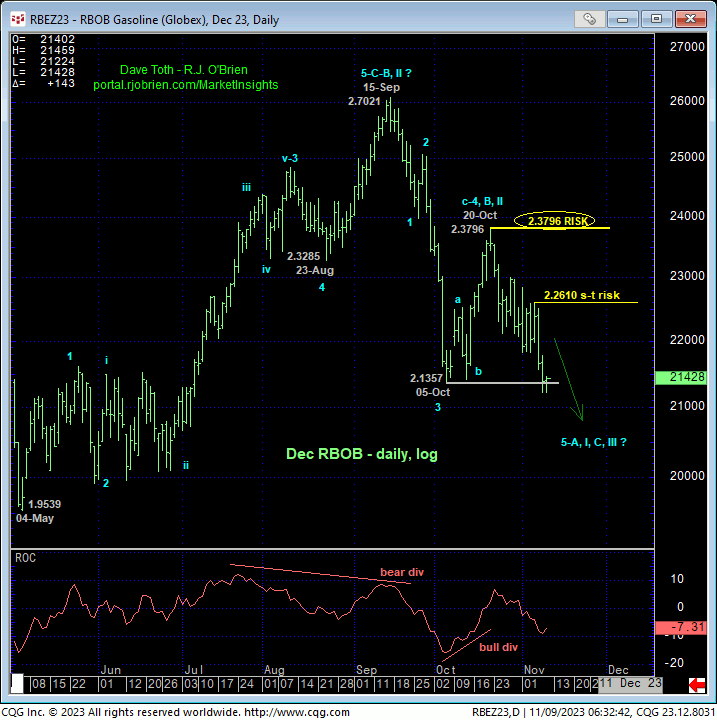
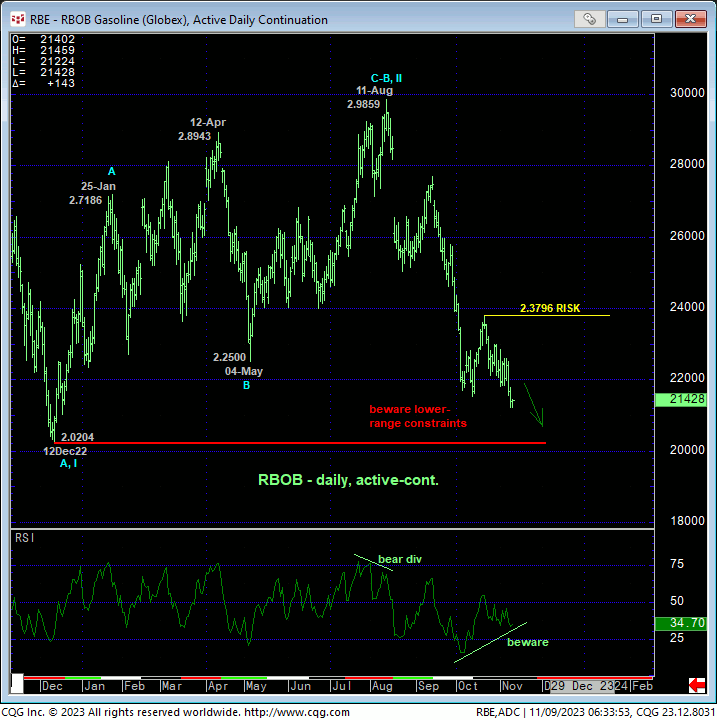
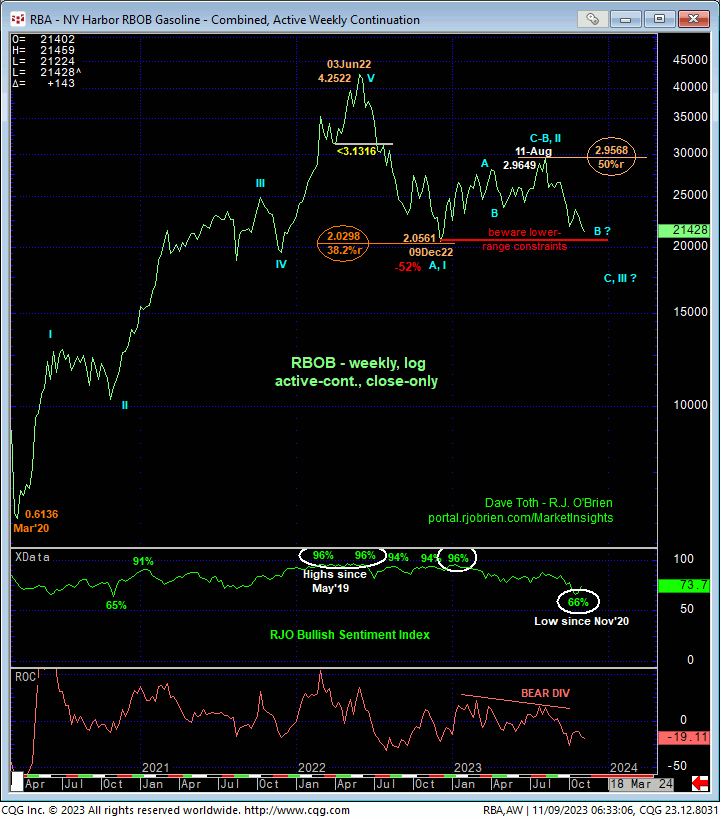
On a longer-term basis, the daily active-continuation chart above and weekly log close-only chart below show the market’s proximity to the extreme lower recesses of the range that has entrapped this market for nearly a year. If there’s a time and place to be leery of another intra-range rebound, it is here and now, and we will navigate such IF/when this market recovers above at least 2.2610. Until and unless such strength is shown, there’s no way to know at this juncture that this current slide isn’t poised to take out the past year’s support that ranges between 09Dec22’s 2.05561 low weekly close and 12Dec22’s 2.0204 intra-day low. And only a glance at the weekly chart below is needed to see that there are NO levels of any technical merit below 2.02 to prevent a free-fall.
These issues considered, a bearish policy and exposure remain advised with a recovery above at least 2.2610 required to defer or threaten this call enough to warrant defensive measures. In lieu of such strength, further and possibly protracted losses should not surprise.
