Posted on Aug 28, 2023, 11:22 by Dave Toth
OCT HEATING OIL
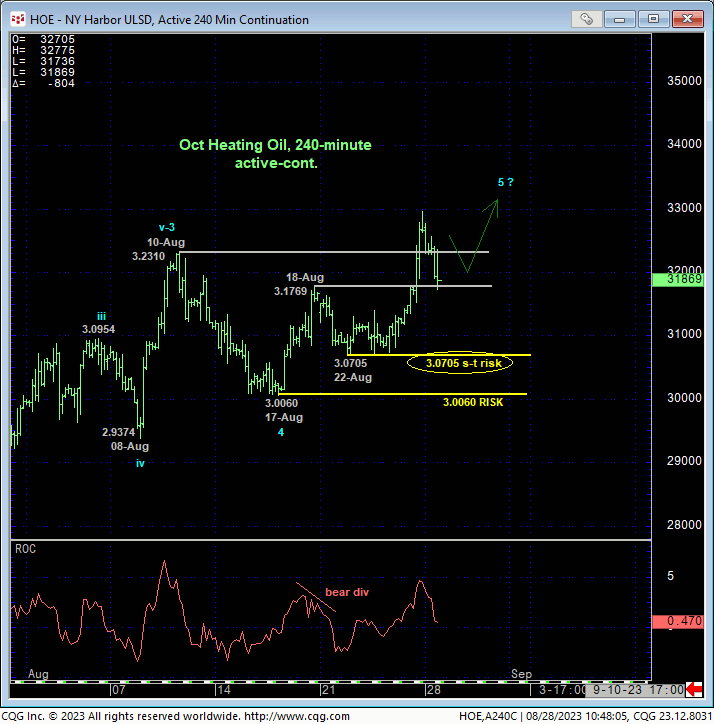
Fri’s recovery above both 18-Aug’s 3.1769 high and especially 10-Aug’s 3.2310 high confirms the mid-Aug sell-off attempt as another corrective affair and reinstates the major recovery from 04-May’s 2.1500 low. This 240-min chart below shows that this resumed strength leaves smaller- and larger-degree corrective lows in its wake at 3.0705 and 3.0060, respectively, that the market is now incumbent to sustain gains above to maintain a more immediate bullish count. Its failure to do so will threaten and then negate the major recovery and expose a correction or reversal lower that may be protracted in scope. Per such, these levels serve as our new short- and long-term parameters from which short- and longer-term traders can objectively rebase and manage the risk of a continued bullish policy and exposure.
Fromer 3.17-to-3.23-area resistance would be expected to hold as new near-term support.
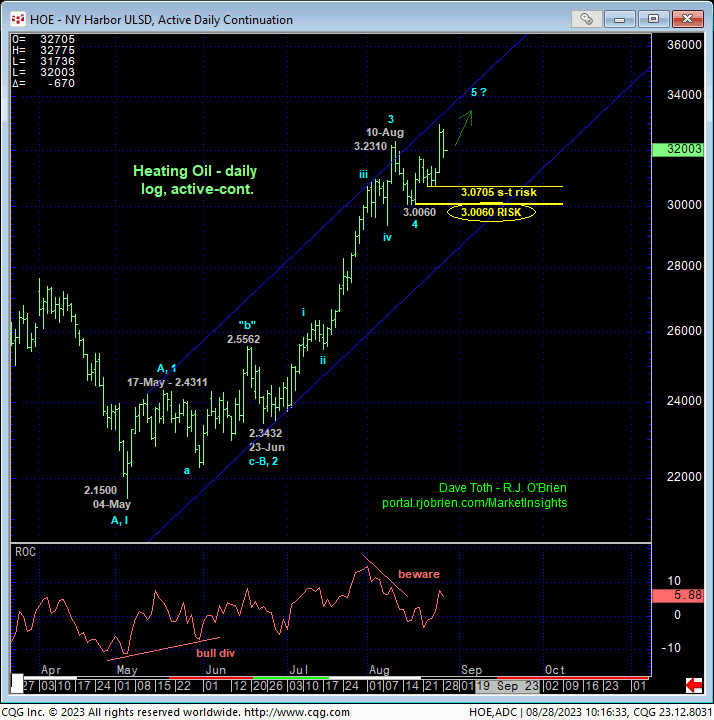
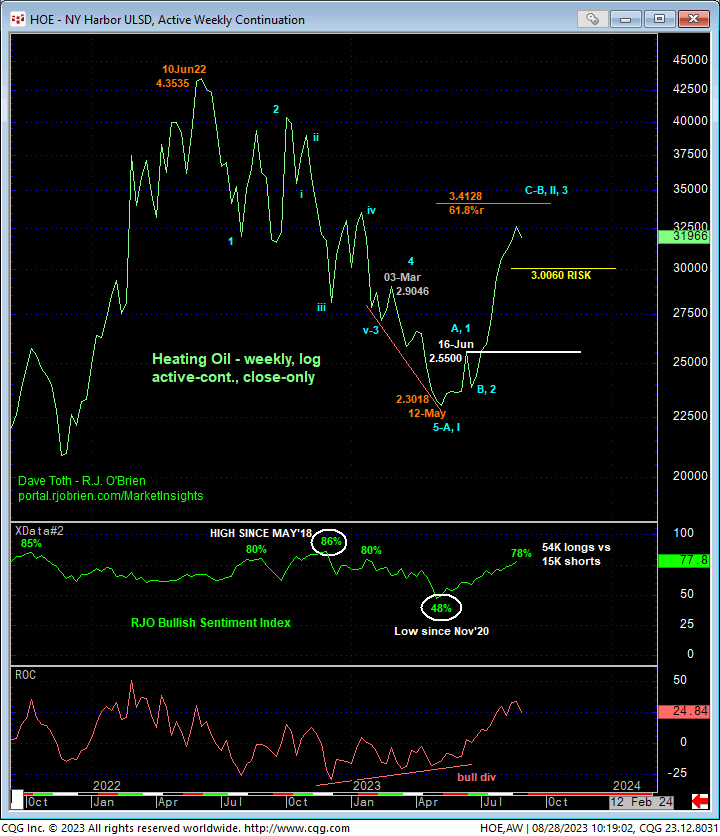
The daily (above) and weekly close-only (below) charts show the magnitude of the past 3-1/2-months recovery. As impressive as this recovery is, until and unless it takes out Jun’22’s all-time high, this recovery remains as a mere (B- or 2nd-Wave) corrective candidate within a massive, multi-quarter topping process. Herein lies the importance of arguably waning upside momentum in the daily chart and the return to historically frothy levels in our RJO Bullish Sentiment Index. These two factors mean little as long as the simple uptrend pattern of higher highs and higher lows keeps on keepin’ on. The moment this uptrend is broken by a failure below 3.0060, the COMBINATION of this mo failure with extreme bullish sentiment presents a favorable risk/reward opportunity to neutralize bullish exposure in order to circumvent the depths unknown of a larger-degree correction or reversal lower. Until and unless such a mo failure is confirmed, the trend is up on all practical scales and should not surprise by its continuance.
These issues considered, a bullish policy and exposure remain advised with a failure below 3.0705 sufficient for shorter-term traders to move to the sidelines and commensurately larger-degree weakness below 3.0060 for longer-term players to follow suit. In lieu of such weakness, further gains remain expected.
OCT RBOB
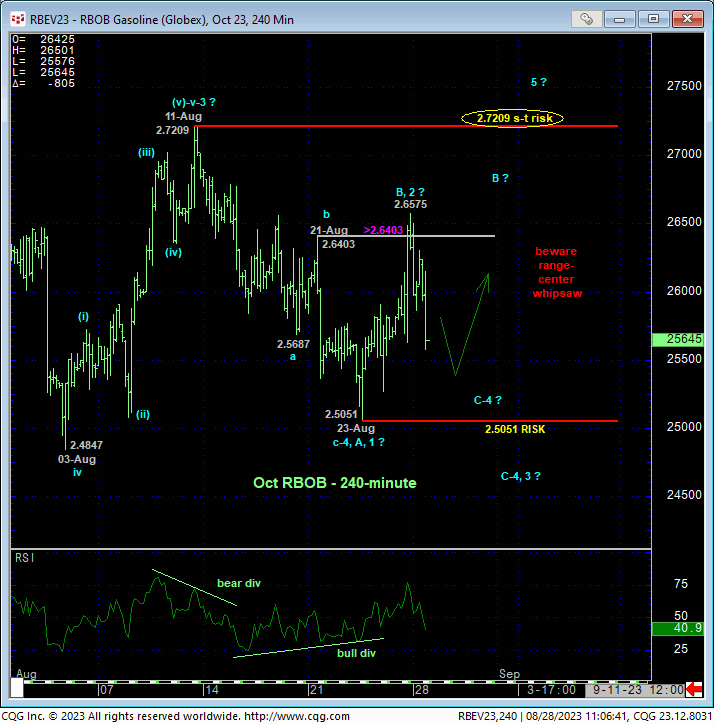
Fri’s recovery above our mini bear risk parameter at 2.6403 threatens our peak/reversal count discussed in 21-Aug’s Technical Webcast and leaves 23-Aug’s 2.5051 low in its wake as our new key long-term bull risk parameter this market needs to sustain gains above IF last week’s 2.5051 low completed a 3-wave and thus corrective setback from 11-Aug’s 2.7209 high. Given the magnitude of Jul-Aug’s rally, even a break below 2.5051 will still leave this month’s setback within the bounds of a mere (4th-Wave) correction. But since a break below 2.5051 will confirm a bearish divergence in daily momentum and since there are NBO levels of any technical merit below 2.5051 shy of the 2.27-handle-area, last week’s 2.5051 low serves as a pivotal longer-term bull risk parameter.
If last week’s 2.5051 low did define the end or lower boundary of a correction within the past quarter’s broader recovery, then we would expect to see another bullish divergence in short-term momentum from a level north of 2.5051 needed to arrest today’s intra-range relapse.
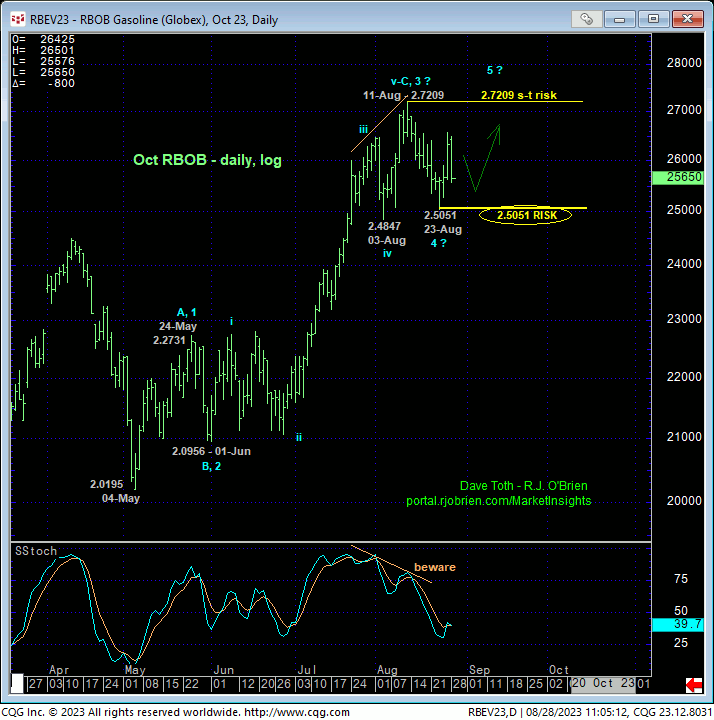
The daily log chart above shows the developing potential for a bearish divergence in momentum that would be considered confirmed on a failure below last week’s 2.5051 low needed to render that low an initial counter-trend low. With the exception of 03-Aug’s 2.4847 intra-day low, there are NO levels of any technical merit shy of former 2.27-area resistance from late-May through all of Jun. The depth of a correction OR reversal below 2.5051 would be a total unknown until/unless stemmed by a countering bullish divergence in mo.
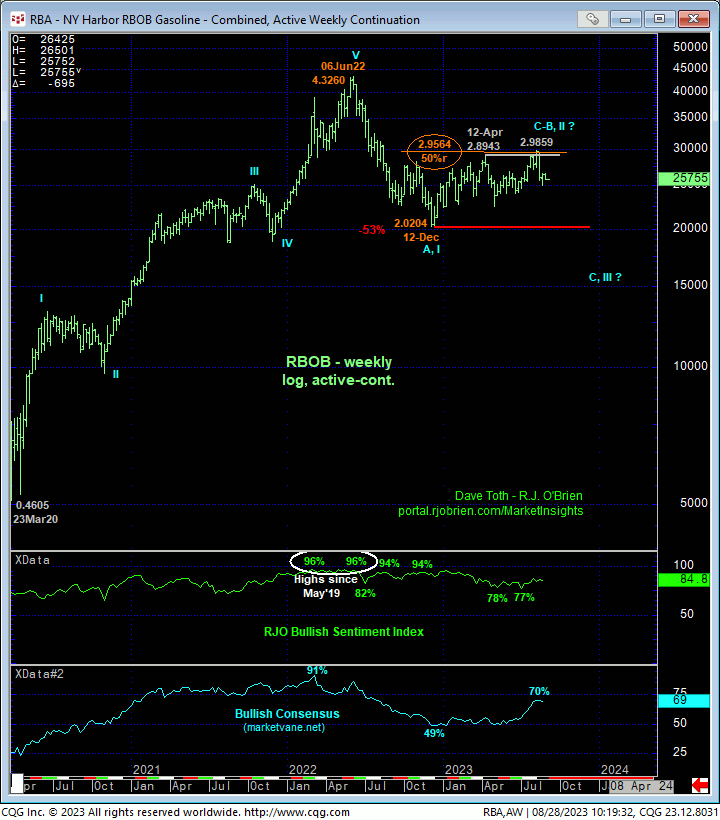
Additionally, the weekly log active-continuation chart below shows 1) the market’s gross failure thus far to sustain early-Aug’s “breakout” above Apr’s key 2.8943 high and 2) the return to historically frothy levels of market sentiment. This latter contrary opinion fact doesn’t matter as long as the uptrend remains intact. A failure below 2.5051 will break the uptrend and expose a correction or reversal lower of indeterminable scope.
These issues considered, a bullish policy and exposure remain advised for longer-term commercial players with a failure below 2.5051 required to not only neutralize all bullish exposure, but also move to at least a cautious bearish policy. Shorter-term traders have been whipsawed by Fri and today’s volatility following mid-Aug’s bearish divergence in mo that warranted a cautious bearish stance. On the heels of Fri’s countering bullish divergence in short-term mo as well as today’s sharp relapse, a neutral/sideline position is advised for the time being.
