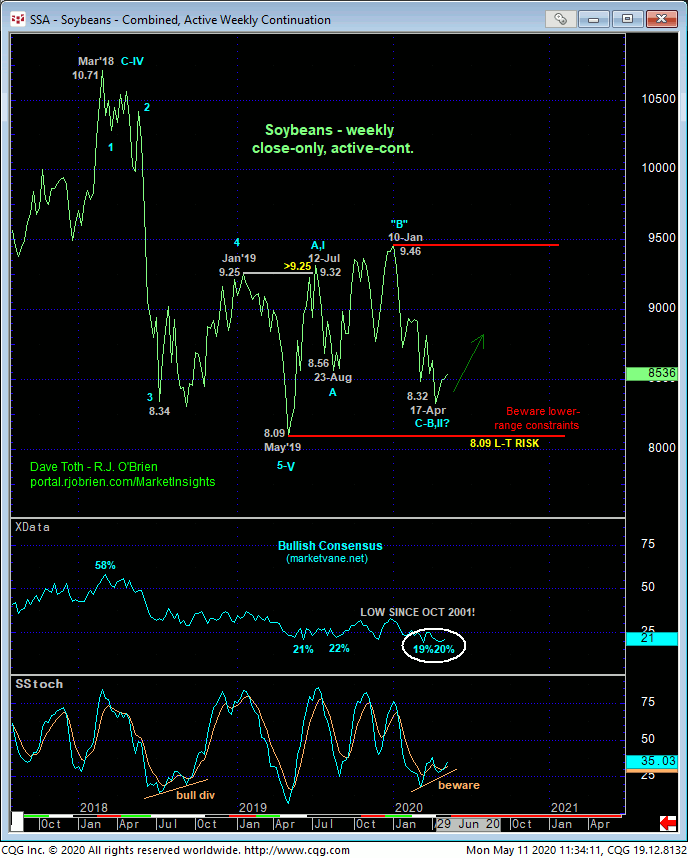
Fri and today’s break above 30-Apr’s 8.59 initial counter-trend high reinforces our base/correction/reversal count introduced in 30-Apr’s Technical Blog following that day’s bullish divergence in short-term momentum above 23-Apr’s 8.56 smaller-degree corrective high. This resumed strength reinforces 28-Apr’s 8.37 low as one of developing importance and the orthodox low to at least the downtrend from 30-Mar’s 8.84 Globex day-session high and possibly the end of this year’s major slide from 02-Jan’s 9.83 high. Per such, this 8.37 low remains intact as our short-term risk parameter from which any non-bearish decisions like short-covers and cautious bullish punts can be objectively based and managed.
To be sure, the recovery attempt from that 8.37 low is thus far only a 3-wave affair that is easily acknowledged as a prospective correction within this year’s longer-term downtrend. But as a direct result of the past couple days’ gains, a relapse below 8.37 is now required to confirm this count. Until and unless such weakness is shown, there is no way to know that the rally from last week’s 8.38 low isn’t the dramatic 3rd-Wave of a broader reversal higher.
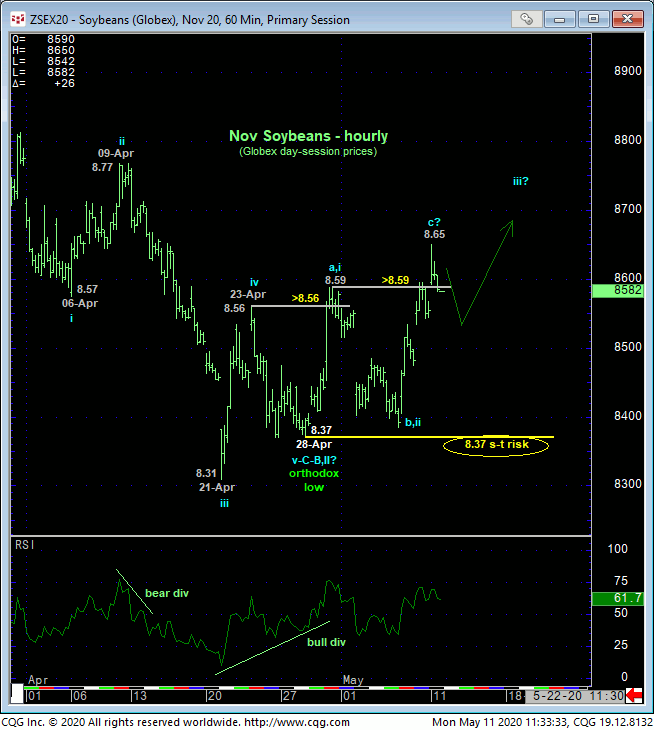
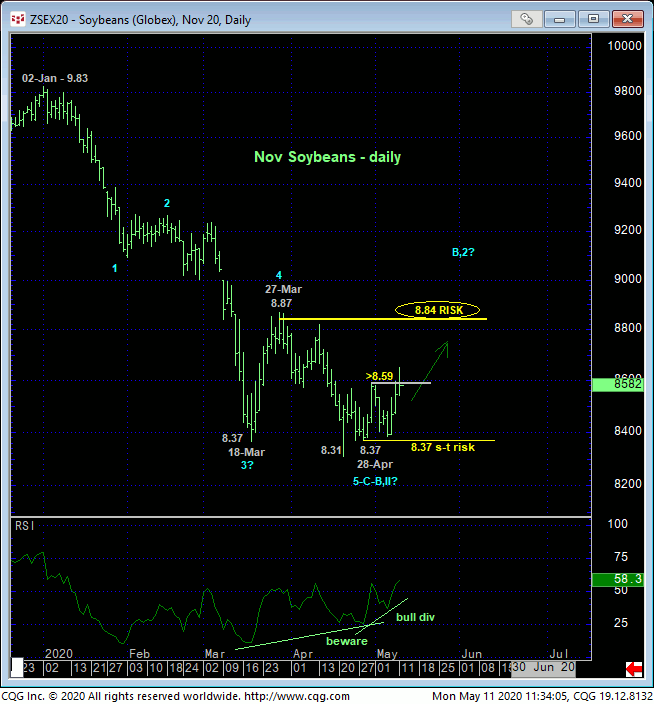
In both daily charts above and below, it’s easy to see waning downside momentum not only over the past few weeks, but even since mid-Mar. Today’s poke above 8.59 confirms a bullish divergence in momentum that identifies 28-Apr’s 8.37 as one of developing importance, but it’s clear that given the magnitude of Jan-Apr’s decline, commensurately larger-degree strength above 27-Mar’s 8.84 Globex day-session larger-degree corrective high and/or that day’s 8.79 corrective high close remains required to confirm a bullish divergence in momentum of a scale sufficient to, in fact, break the year’s downtrend and confirm the new long-term trend as up. Per such, until such strength is shown, we have to keep alert to the still-bearish prospect that the past couple weeks’ recovery attempt might only be another correction ahead of resumed losses. And herein lies the importance of our 8.37 short-term risk parameter.
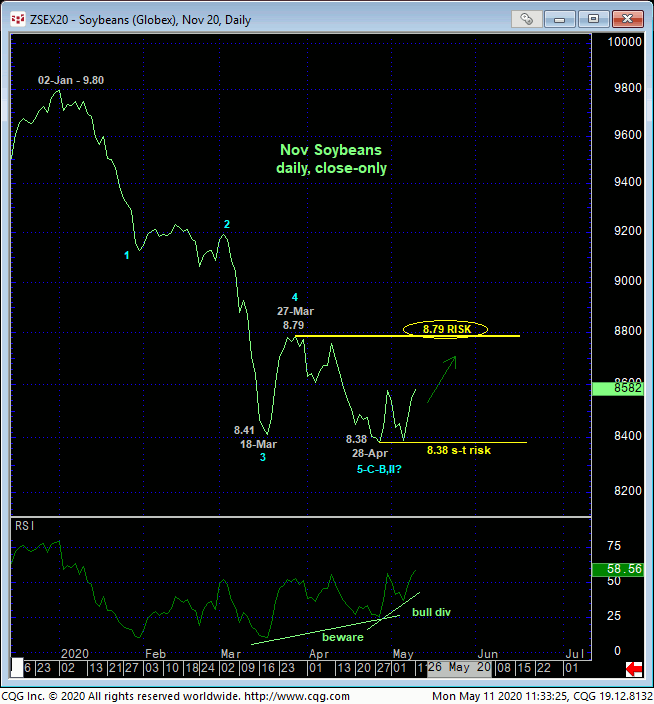
On an even longer-term weekly close-only basis below:
- waning downside momentum
- the market’s proximity to the extreme lower recesses of the past couple years’ range amidst
- historically bearish levels in the Bullish Consensus (marketvane.net) not seen since 2001
would seem to contribute to a base/reversal-threat environment that could be major in scope.
These issues considered, shorter-term traders have been advised to move to a cautiously bullish stance with a failure below 8.37 required to negate this count and warrant its immediate cover. Long-term players are OK to maintain a cautious bearish policy with commensurately larger-degree strength above the 8.79-to-8.84-area required to negate this count, warrant its cover and reversal into a cautious bullish policy. See below for end-user bull hedge, producer bear hedge and spec option strategies.
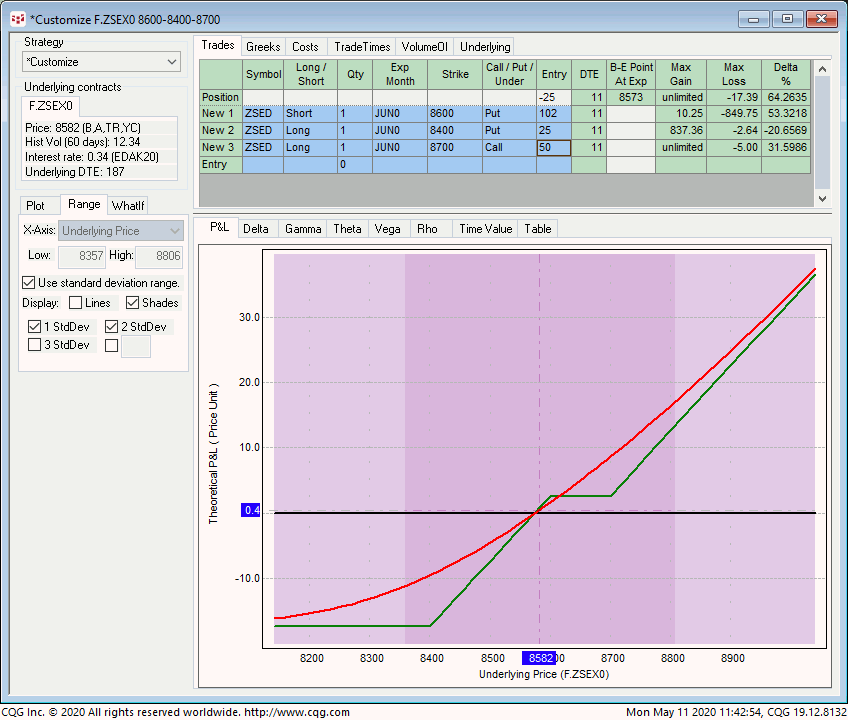
END-USER BULL HEDGE: SHORT JUN SHORT-DATED 8.60 – 8.40 PUT SPREAD / LONG JUN SHORT-DATED 8.70 CALL COMBO
Acknowledging that the Jun short-date options only have 11 days to expiry on 22-May, this is strategy structure around a sharp reaction to tomorrow’s key crop report. This strategy involves selling the Jun short-dated 8.60 – 8.40 put spread for about 7-1/2-cents and buying the Jun short-dated 8.70 calls around 5-cents for a net DEBIT of about 2-1/2-cents. This strategy provides:
- a current net delta of +64%
- favorable margins
- a small profit of 2-1/2-cents if the underlying Nov contract settles anywhere between 8.60 and 8.70 at expiration on 22-May
- maximum risk/cost of 17-1/2-cents on ANY decline below 8.40
- unlimited, dollar-for-dollar upside protection above 8.70.
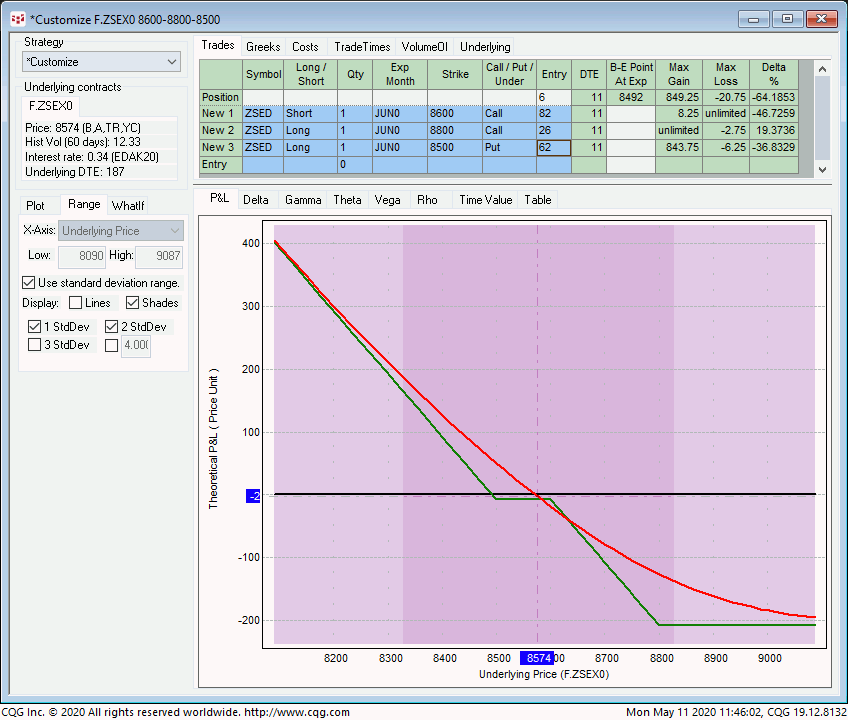
PRODUCER BEAR HEDGE: SELL JUN SHORT-DATED 8.60 – 8.80 CALL SPREAD / BUY JUN SHORT-DATED 8.50 PUT COMBO
This strategy is the opposite of the bull hedge strategy above and involves selling the Jun short-dated 8.60 – 8.80 call spread for about 5-1/2-cents and buying the Jun short-dated 8.50 puts around 6-1/4-cents for a net cost of about 3/4-cents. This strategy provides:
- a current net delta of -64%
- favorable margins
- a small 3/4-cent loss if the underlying Nov contract settles anywhere between 8.50 and 8.60 at expiration on 22-May
- maximum risk/cost of 21-cents on ANY rally above 8.80 that would allow underlying cash position to profit
virtually unlimited, dollar-for-dollar downside protection below its 8.49 breakeven point at expiration.
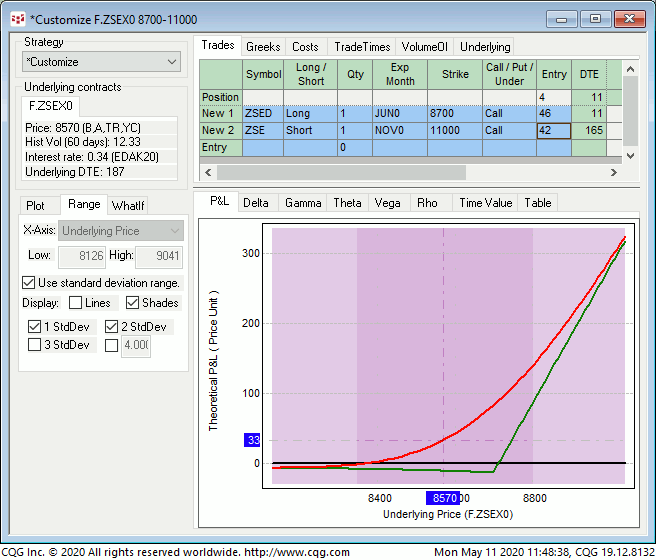
SPEC: LONG JUN SHORT-DATED 8.70 / NOV 11.00 CALL DIAGONAL
This strategy involves buying 1-unit of the jun short-dated 8.70 calls around 4-3/4-cents and selling the Nov 11.00 calls around 4-1/2-cents for a net cost of about a 1/2-cent. This strategy provides:
- a current net delta of +28%
- a massive 30:1 gamma ratio
- negligible risk if the underlying Nov contract collapses
- theoretically 2.40-cents profit potential on a sustained reversal above 8.70.
The real risk to this, like any diagonal strategy is flat-lining price action in the underlying contract that will likely mean the long call (in this case) to expire worthless, leaving a naked short position in the deferred-month, far-out-of-the-money 11.00 Nov call that, theoretically, poses unlimited risk. But proper management of this position will never allow this risk to come to pass as this position should be neutralized in its entirety if the market doesn’t spike high and sustain higher prices over the next week or so.
Please contact your RJO representative for updated bid/offer quotes on these strategies, and good luck on tomorrow’s numbers.