Just when tensions in North Korea started to die down and Retails Sales showed a surprising uptick, it looked like that would be the one two punch needed to break this silver market. That’s when the FED minutes showed that the current participants of the FOMC committee was split over when to raise interest rates, breathing a new sign of life into silver.
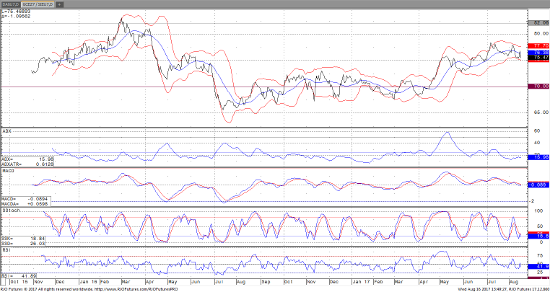
Currently, the bulls have regained full control with silver trading back above $17/oz, and it will need to punch through $17.30 to put $18 in the cards. One of the key ratios to keep an eye on is the Gold/Silver ratio that measures the number of ounces of silver it takes to buy one ounce of gold. Knowing that the ratio is still trading at lofty levels and an extreme along with a low volatility environment, I have outlined a strategy to try and take advantage of a rally using options.
Weekly Focus
With the FED minutes behind us indicating expectations for another rate hike have diminished and further reduction of the balance sheet hasn’t yet been fully outlined, I believe that silver will see the next major rally on the heels of low inflation environment.
Daily Chart Analysis and Price Outlook – Gold/Silver Ratio

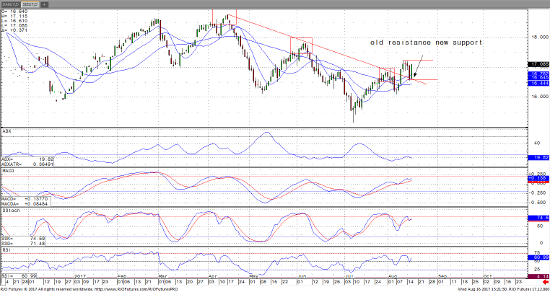
Sep ’17 Silver Daily Chart

Analysis and Outlook
The daily silver chart shows a sliding channel formation with small tops at $18.75, $17.75, and $16.75 where the breakthrough to the upside has created an all new chart pattern with $17.25 being a key level of resistance. I would expect a breakout about this level would trigger a rally back up to $18. While expecting the recent low point at $16.50 in price and volatility, I have designed a strategy that involves writing short dated put options while using longer dated call spreads to attempt to take advantage of a longer term price recovery. I would expect prices to recover to back to normalized levels back above $18/oz. by year end.


