MAR EURO
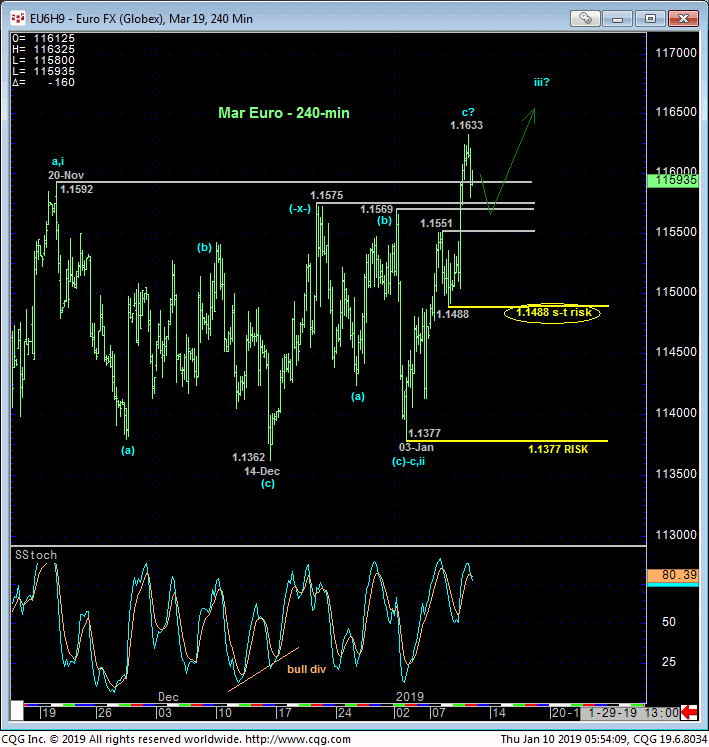
Yesterday’s breakout above a ton of former resistance between 1.1550 and 1.1590 reinforces our bullish count introduced in 20-Dec’s Technical Blog. As always after such trend resumptions, the important by-product of this resumed strength is the market’s definition of smaller- and larger-degree corrective low the bull is now required to sustain gains above to maintain a more immediate bullish count. The 240-min chart below shows prior corrective lows at 1.1488 and 1.1377. These levels represent our new short- and longer-term risk parameter from which a bullish count and exposure can be objectively rebased and managed.
IF the market has something more significant to the upside in store as a result of this 1.1590+ breakout- like the 3rd-Wave of an eventual and steep 5-wave sequence higher- we would fully expect now-former 1.1590-to-1.1550-range resistance to hold as new support. This market should even come close to even Tue’s 1.1488 smaller-degree corrective low, let alone fail below it. What SHOULD happen under such a broader bullish count is increasingly obvious trending/impulsive behavior higher. And straight away.
The bull has created a great opportunity to PERFORM by breaking above the past TWO MONTHS’ resistance. Its inability to do so, indicated by a failure below 1.1488, will not only threaten a broader bullish count, it will raise the odds that the broader recovery attempt from 12-Nov’s low is a 3-wave and thus corrective structure that will re-expose the 2018 bear to new lows below 1.1250.
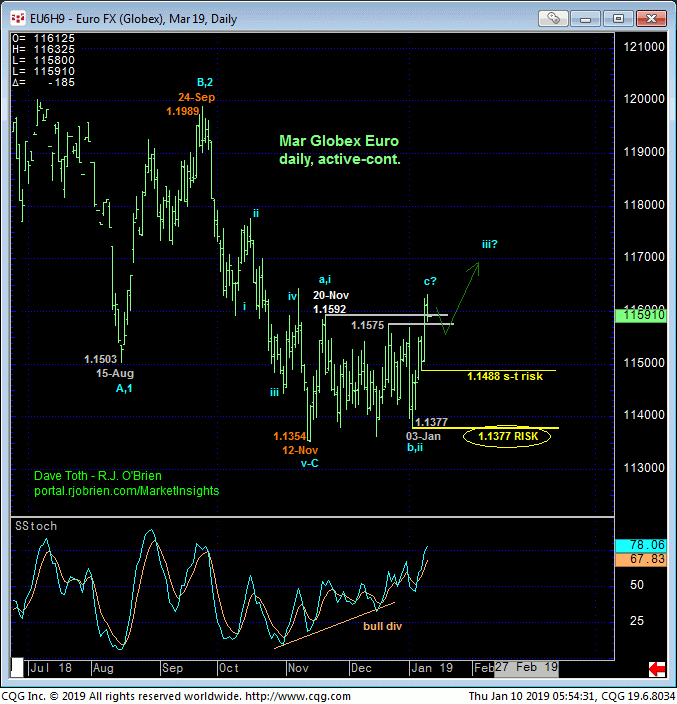
The daily chart of the Mar contract above shows yesterday’s breakout above the past couple months’ resistance that resurrects a broader base/correction/reversal count from 12-Mar’s 1.1354 low. For longer-term reasons we’ll discuss below, the euro’s upside potential may be extensive. However, it is absolutely crucial for the bull to perform right now! And in an increasingly obvious, impulsive way. For the countering argument is that the past two months’ recovery attempt is about as labored and 3-wave-corrective as in gets.
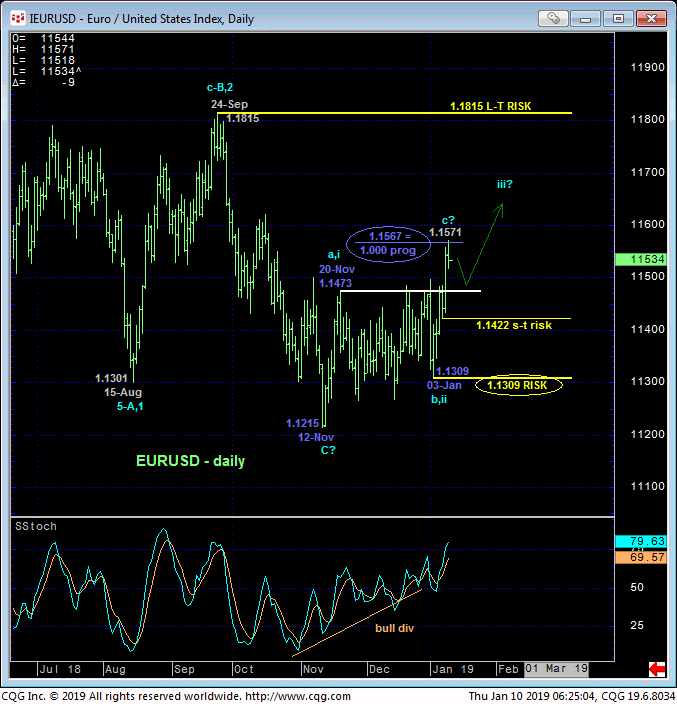
Per such an alternative bear market correction count, it’s interesting to point out in the cash market below, the Fibonacci fact that the prospect c-Wave of the correction from 03-Jan’s 1.1309 low is identical in length (i.e. 1.000 progression) to Nov’s initial and prospective a-Wave pop from 1.1215 to 1.1473. As always, we will never RELY on such merely derived technical levels as resistance, but combined with a confirmed momentum failure below 1.1422, this Fibonacci relationship and wave count would tip the longer-term directional scales back to the bear side with the prospect of new lows below the early-Nov lows.
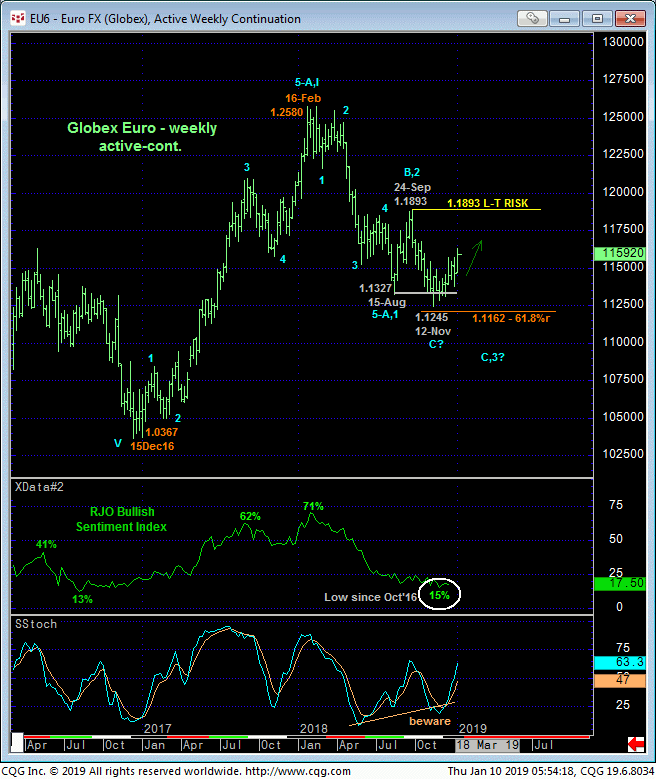
Finally, the weekly active-continuation chart of the contract below shows the market’s failure to sustain Nov losses below Aug’s 1.1327 low amidst historically bearish levels in our RJO Bullish Sentiment Index of the hot Managed Money positions reportable to the CFTC. This is exactly the type of contrary opinion data that warned of and accompanied Dec’16’s major base/reversal environment and warns of another such base/reversal count now, especially after yesterday’s breakout above 1.1590. But again, it’s imperative that the bull PERFORM in 3rd-wave-style straight away. A relapse below even a smaller-degree corrective low and risk parameter like 1.1488, and certainly below 03-Jan’s pivotal 1.1377 larger-degree corrective low, will threaten and then negate any bullish count and resurrect a major bearish one.
These issues considered, traders are urged to toggle directional biases and exposure around 1.1488, being long and bullish above this level and out/bearish below it. And given that the EURGBP cross suggests that sterling remains a weaker sister to the euro, sterling’s bearish prospects would be reinforced if the euro fails below 1.1488.
MAR BRITISH POUND
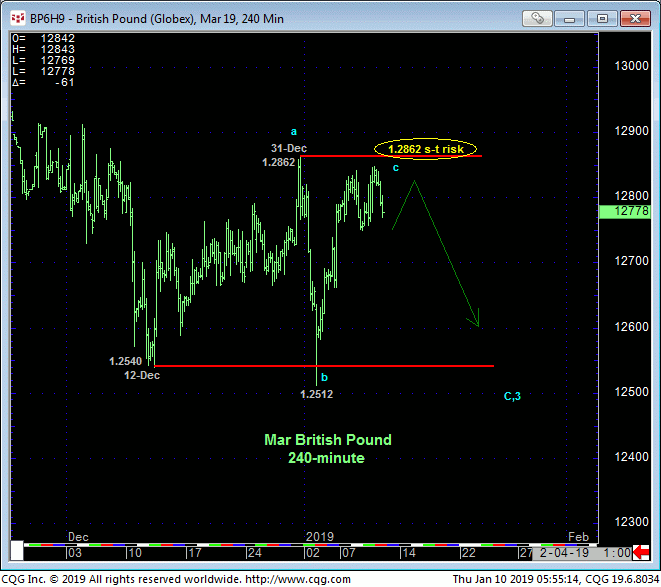
The market’s failure to sustain 03-Jan’s spasm below 12-Dec’s 1.2540 low and subsequent rebound back to the upper recesses of the past month’s range mitigates the more immediate bearish count discussed in 03-Jan’s Technical Blog, but it does not yet negate our broader bearish count. Rather, we maintain that this rebound if the completing c-Wave of the correction that began with 12-Dec’s 1.2540 low and labeled in the 240-min chart below. We maintain 31-Dec’s 1.2862 high as our short-term risk parameter this market remains required to recoup to threaten this bearish count enough to warrant paring or neutralizing still-advised bearish exposure.
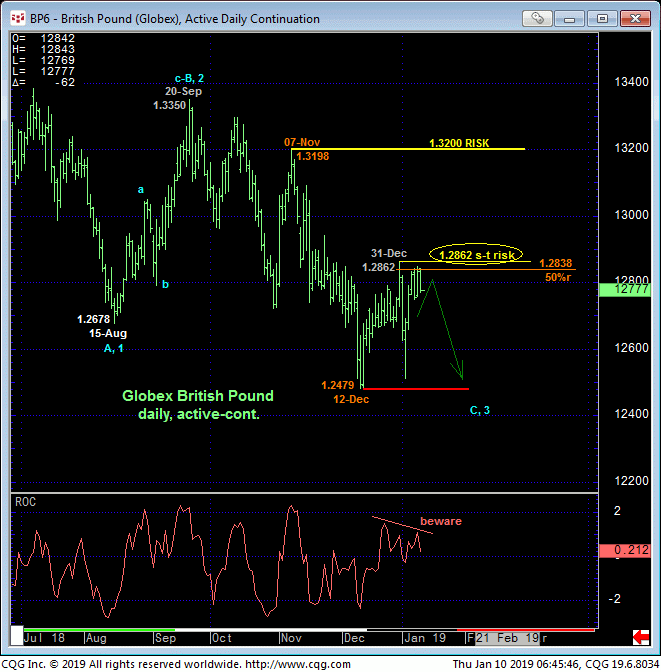
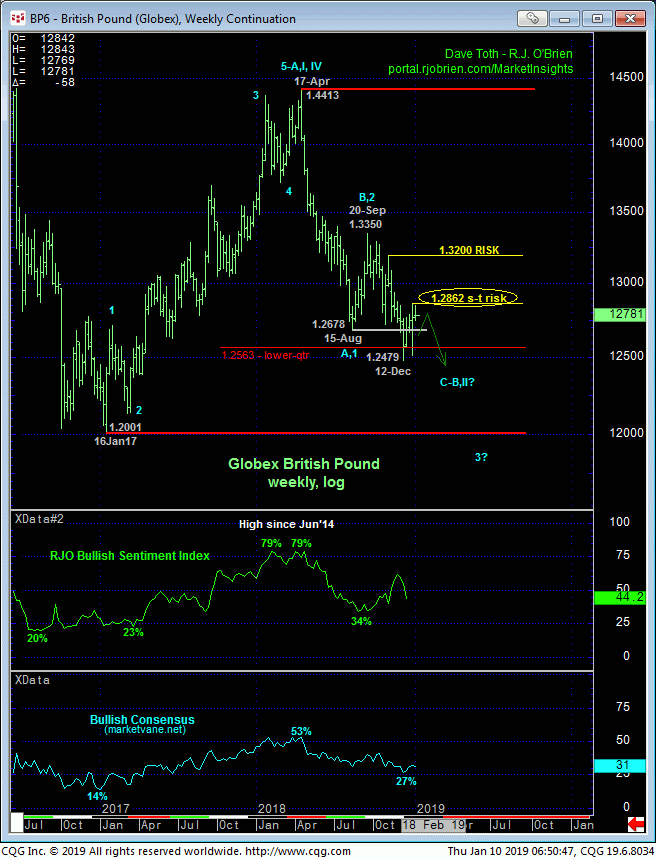
The daily active-continuation chart of the contract above shows the thus-far 3-wave recovery attempt from 12-Dec’s 1.2479 low that has stalled around the (1.2838) 50% retrace of Nov-Dec’s 1.3198 – 1.2479-portion of 2018’s major bear trend. While the market’s failure to sustain Dec losses below mid-Aug’s 1.2678 low cannot be ignored as an early indication of resolve within a broader BASE/reversal count, further and impulsive and commensurately larger-degree strength above at least the 1.28-handle is required to tilt the longer-term directional scales that way. Until such strength is proven, the backdrop of 2018’s broader bear trend warrants first approaching this thus-far labored recovery attempt as a 3-ave and thus corrective affair that warns of a resumption of 2018’s major downtrend that preceded it.
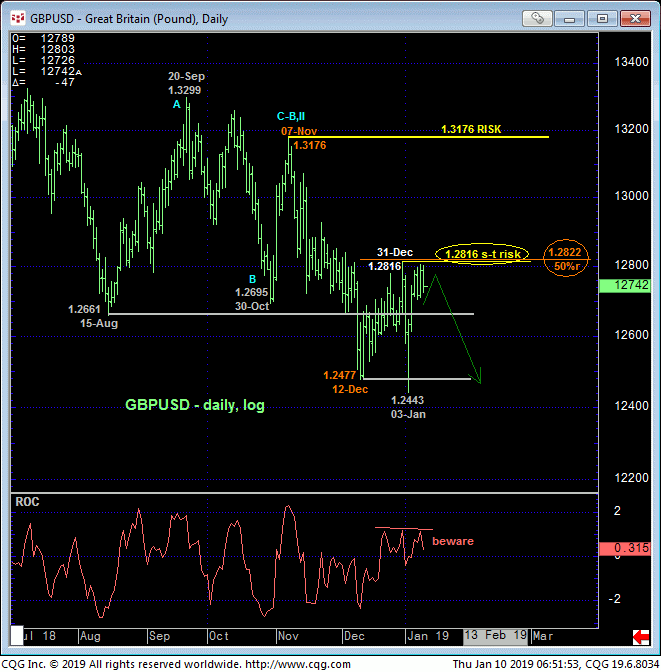
31-Dec’s 1.2816 high to this recovery attempt thus far in the cash market below is only a few pips from the (1.2822) 50% retrace of Nov-Dec’s 1.3176 – 1.2477-portion of the major bear and would seem to be reinforcing factor to a bearish count.
The weekly log scale chart of the contract below shows:
- the market’s proximity to the lower-quarter of the past couple years’ range amidst
- historically bearish levels in the Bullish Consensus (marketvane.net) measure of market sentiment and
- the market’s failure thus far to sustain Dec’s break below Aug’s 1.2678 low,
So the market’s not totally devoid of prospective/hopeful bullish technical. BUT…the bull simply has to PROVE itself at this critical juncture, and we believe that means an impulsive spike above the 1.28-handle in general and above 1.2862 specifically. In lieu of such strength we believe 2018’s major downtrend will resume to at least one more round of new lows below 1.2479. And with the market currently flirting with the extreme upper recesses of the past month’s suspected consolidation range, the risk/reward merits of bearish exposure from 1.2800 OB with protective buy-stops above 1.2862 are very favorable.
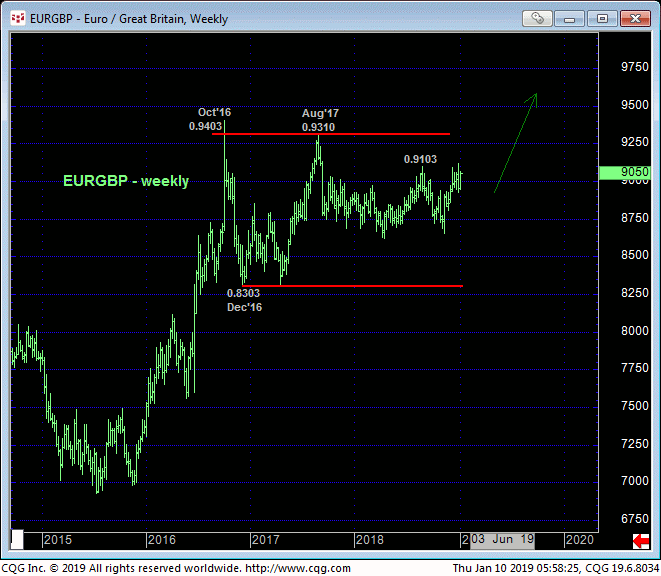
Finally, with respect to the relationship between the euro and sterling shown in the weekly chart of the EURGBP cross, we’ve discussed before the lateral range that has constrained this market for the past couple years. This maintains a generally positive correlation between the two, at least for the time being. So if the euro bull continues to perform, we’re likely to be wrong on our bearish call in sterling. If the Mar euro fails below 1.1488, it is highly likely that sterling’s going to tube as well.
But here’s the interesting thing. The past two years’ lateral behavior in the cross is arguably merely corrective/consolidative, warning of an eventual resumption of 2015-16’s major uptrend that preceded it. We’re not saying necessarily that the euro can maintain a base/reversal count while the sterling resumes 2018’s major downtrend. But a decoupling of this recently positive correlation between the two should not come as a surprise. And if the euro does indeed fail to sustain this week’s breakout above 1.1550-to-1.1590 with a failure below 1.1488, it is very likely that sterling’s performance will be even more bearish.
