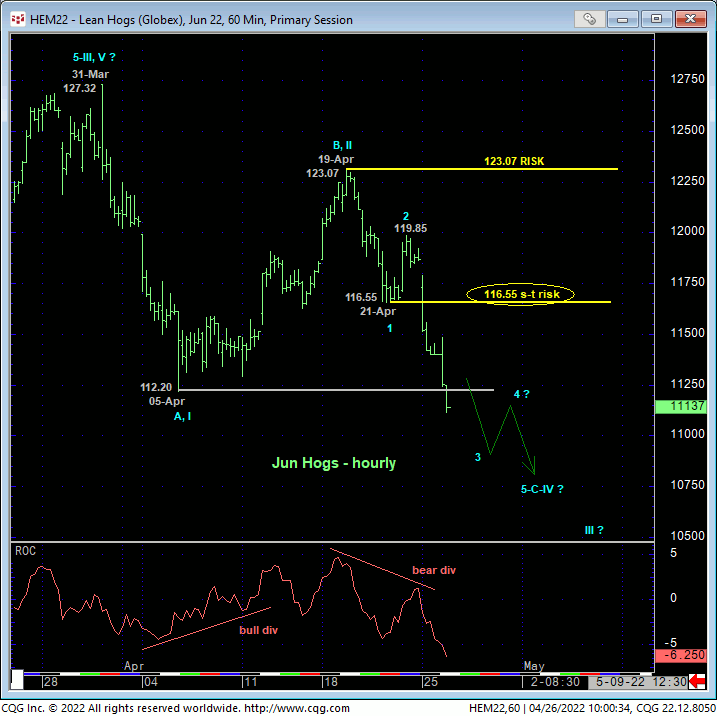
In 04-Apr’s Technical Blog following a bearish divergence in short-term momentum, we introduced some longer-term ancillary elements that were typical of larger-degree peak/reversal-threat environments. At that time, that shorter-term mo failure was of an insufficient scale to conclude a larger-degree top. Today’s break below 05-Apr’s 112.20 initial counter-trend low and long-term risk parameter IS of such a scale, confirming a bearish divergence in both daily and WEEKLY momentum that threatens the secular bull market.
This mo failure defines 19-Apr’s 123.07 high as a larger-degree corrective high and our new log-term risk parameter from which longer-term commercial players can objectively base non-bullish decisions like long-covers and new bear hedges. IF the large-degree sell-off attempt from 31-Mar’s 127.32 high is a major (4th-wave) correction, the market must now recover above this level to render the past month’s decline a 3-wave and thus corrective structure.
From a shorter-term perspective, 21-Apr’s 116.55 low is the minor 1st-Wave low of an eventual 5-wave sequence down from 123.07 and the minimum level this market must now recoup to jeopardize the impulsive integrity of a much broader bearish count. Per such, this 116.55 level is considered our new short-term risk parameter from which shorter-term traders with tighter risk profiles can objectively rebase and manage the risk of non-bullish decisions like long-covers and new bearish punts.


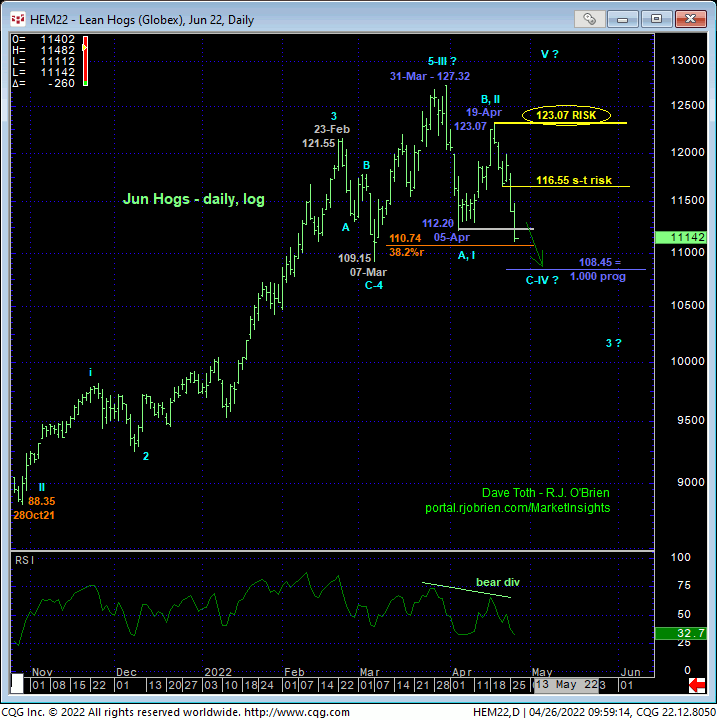
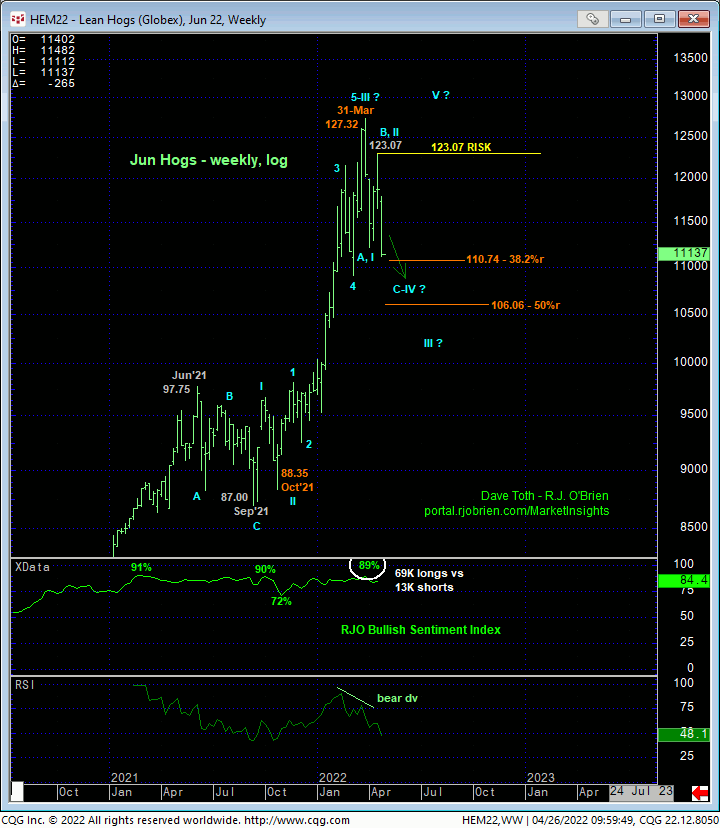
The daily (above) and weekly (below) log scale charts of the Jun contract show today’s break below 05-Ar’s 112.20 initial counter-trend low. This confirms a bearish divergence in WEEKLY momentum that breaks the uptrend from at least Oct’21’s 88.35 low and possibly from Sep’21’s 87.00 low. Combined with still-historically-frothy levels in our RJO Bullish Sentiment Index, this market should be considered vulnerable to steep, sustained losses until and unless mitigated by a confirmed bullish divergence in momentum needed to define some semblance of support.
From an Elliott Wave perspective, the magnitude of the rally from last Sep’s low is such that 31-Matr’s 127.32 high might have only completed 3-waves up, suggesting the past month’s sell-off is a major 4th-Wave correction ahead of a major 5th-Wave rally to one more high above 127.32. 4th-waves, being within the context of the major uptrend, typically correct or retrace a more minimal amount like 38.2% as the underlying forces of the major bull are still present. In the daily and weekly log scale charts, this 38.2% retrace of the prospective 3rd-Wave rally from Oct’21’s 8.35 low to 31-Mar’s 127.32 high cuts across at 110.74. The 1.000 progression of early-Apr’s prospective A-Wave decline from 127.32 to 112.20, taken from the prospective B-Wave high at 123.07, projects to 108.45. Per such, and IF the decline from 123.07 is the completing C-Wave of a 4th-Wave correction within the still-unfolding secular bull trend, we would expect the market to arrest the clear and present downtrend with a bullish divergence in momentum somewhere around the 110-to-108-area.
Conversely, the only other wave that could be unraveling from 123.07 is the dramatic 3rd-Wave of a major reversal lower. 3rd-waves are characterized by steep, sustained, even relentless directional moves devoid of any bullish (in this case) divergences in momentum. And one of the drivers of such an increasingly obvious move is the capitulation of losing bullish (in this case) exposure by the huddled masses. Herein lies the importance of the extent to which the Managed Money community has its collective neck sticking out on the bull side. This is fuel for downside vulnerability.

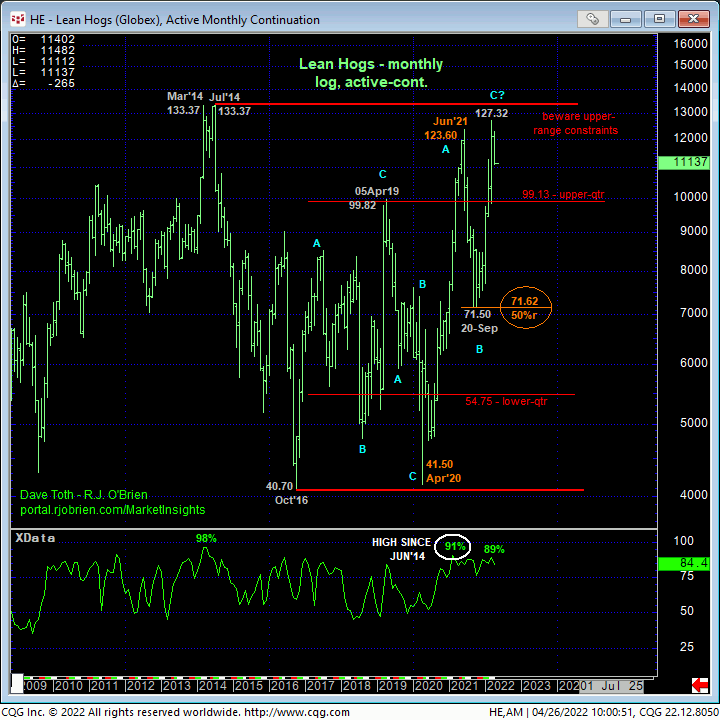
Finally, on an even longer-term monthly scale, the chart below shows the market proximity to the extreme upper recesses of its massive historical range. “Up here”, bullish technicals need to remain in place to maintain a bullish policy and exposure. CLEARLY, for Elliott, momentum, sentiment and long-term range reasons specified above, any bullish technical construct has been compromised enough to warrant moving to at least a neutral/sideline/bear-hedged position. To resurrect any bullish construct, this market must recoup at least the 116.55 level and preferably 19-Apr’s 123.07 high. In lieu of such strength, further and possibly steep, sustained, accelerated losses straight away are anticipated, warranting a new bearish policy and exposure from current 112-handle-area prices.


