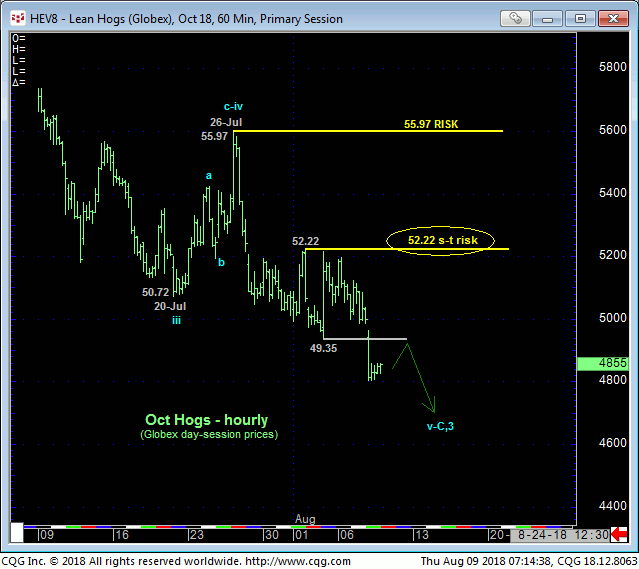
Yesterday’s resumed slide below the past week’s 49.35-area support reaffirms the major bear trend and leaves 01-Aug’s 52.22 high in its wake as the latest smaller-degree corrective high the market needs to sustain losses below to maintain a more immediate bearish count. Its failure to do so will confirm a bullish divergence in momentum that would at least stem the slide and expose an interim correction higher. But given the market’s headline plunge to historically low levels. currently, even a smaller-degree momentum failure cannot be ignored as the trigger for a more protracted base/reversal-threat environment.


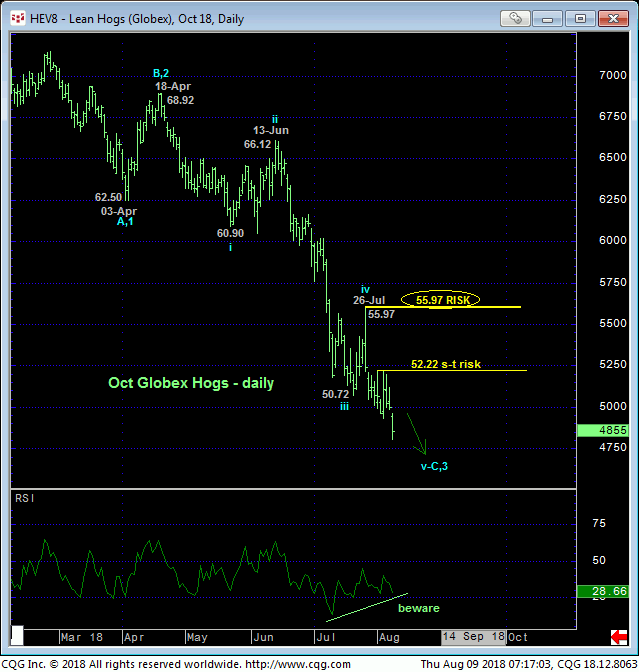
The daily chart above shows 1) the clear and present downtrend and 2) the developing POTENTIAL for a bullish divergence in momentum. But strength above at least 52.22 and preferably 26-Jul’s 55.97 next larger-degree corrective high and key risk parameter is required to CONFIRM the divergence to the point of non-bearish action like short-covers and cautious bullish punts.
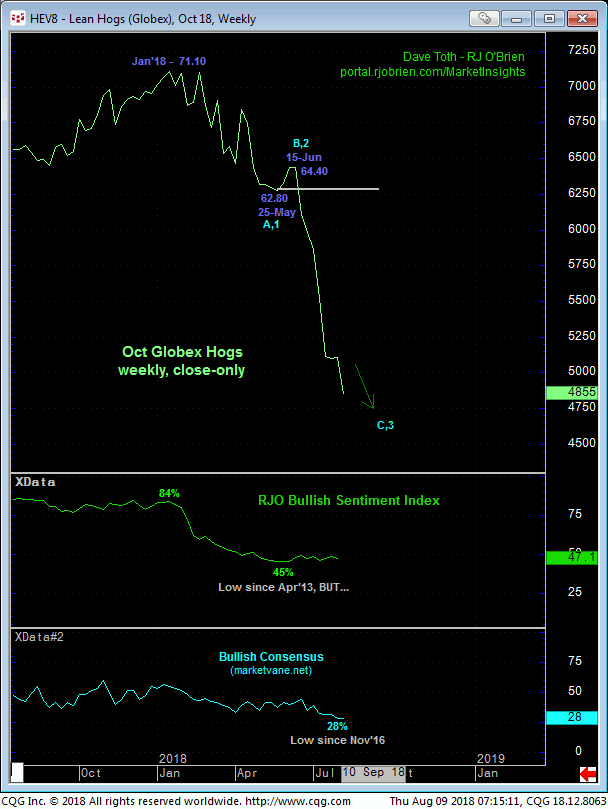
The bear trend is obvious in the weekly close-only chart below that also shows historically bearish levels of market sentiment. Such pessimistic sentiment/contrary opinion levels are typical of major BASE/reversal environments. But traders are reminded that sentiment is not an applicable technical tool in the absence of a confirmed bullish divergence in momentum needed to stem the clear and present downtrend. Herein lies the crucial importance of identifying objective and specific bear risk levels like 52.22 and 55.97.


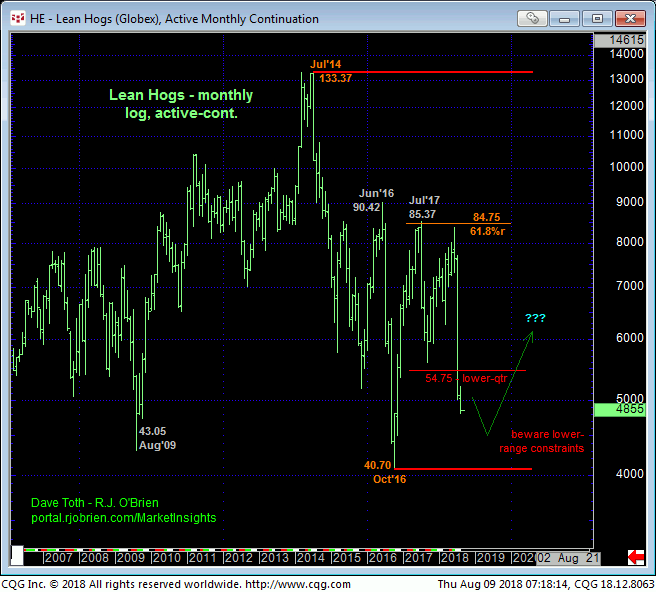
The momentum, sentiment and risk parameters discussed above are critically important given the recent plunge to historically low levels that the market has had great difficulty sustaining in the past. The monthly log active-continuation chart above shows the market’s engagement of the lower-quarter of the past 10 YEARS’ range. If there’s a time and place for the bear to peter out and offer an outstanding, long-term risk/reward buying opportunity, we believe it will be over the next one-to-three months. Indeed, this market has a pretty decent history of establishing major bottom between Aug and Nov.
Looking back even farther, over the past 45 years, the quarterly log close-only chart below shows a median range of roughly 54-to-80. The pendulum has swung outside this range over the past generation-and-a-half, but only temporarily, offering outstanding opportunities to fade those departures from the mean.
There’s no question that the trend is down currently and should not surprise by its continuance or acceleration. And a full and aggressive bearish policy and exposure remain advised with strength above at least 52.22 and/or 55.97 required to pare or neutralize this exposure commensurate with one’s personal risk profile. But traders also need to be aware of current low levels that, historically, have provided outstanding long-term buying opportunities, especially headed into the Aug-Nov time frame. And MOMENTUM will be our technical focus to navigate such a prospective base/reversal process.

