Posted on Jan 17, 2024, 10:20 by Dave Toth
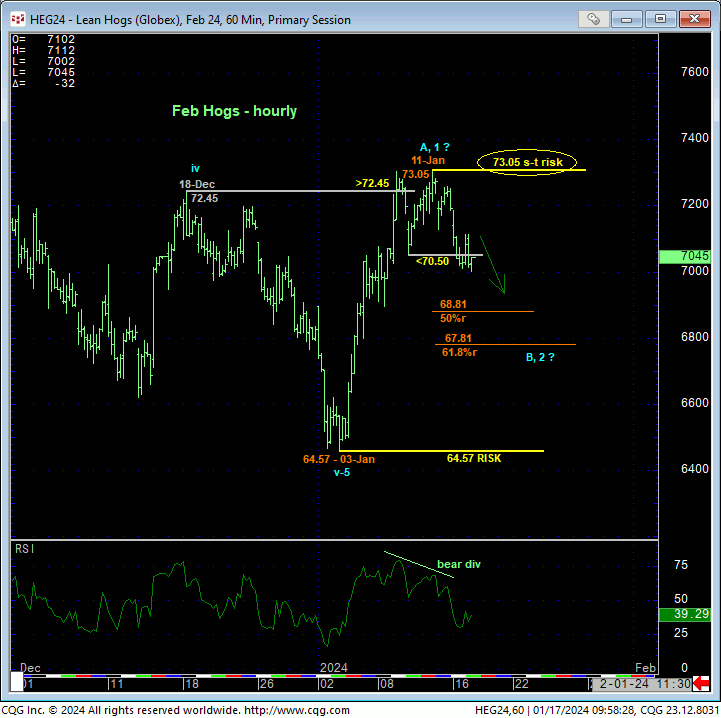
In yesterday morning’s Technical Webcast we discussed 10-Jan’s 70.50 minor corrective low as the level the market needed to sustain gains above to maintain a more immediate bullish count. The hourly chart below shows the market’s failure to do so, confirming a bearish divergence in short-term mo that defines 11-Jan’s 73.05 high as the END of early-Jan’s recovery from 64.57 and start of at least a (B- or 2nd-Wave) corrective rebuttal of the 64.57 – 73.05 (A- or 1st-Wave) rally and possibly a resumption of the secular bear market. Per such, last week’s 73.05 high is considered our new short-term parameter from which the risk of non-bullish decisions like long-covers and bearish punts can now be objectively based and managed.

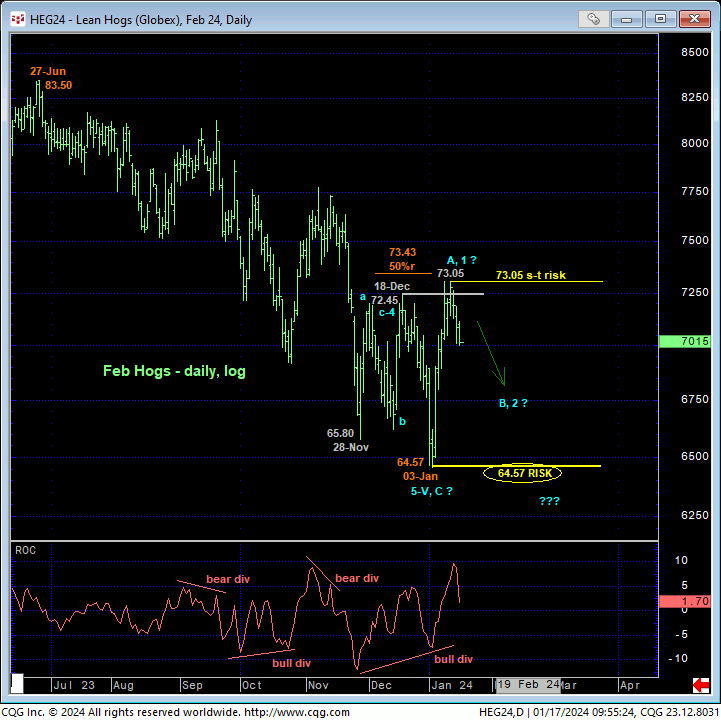
IF the expected setback is “only” a corrective rebuttal to early-Jan’s spike, this setback should be expected to be arrested by a countering bullish divergence in momentum at a level above 03-Jan’s obviously pivotal 64.57 low, perhaps around the 50% or 61.8% retraces of early-Jan’s rally that cut across at 68.81 and 67.81. For needless to say, a break of 64.57 will chalk up Jan’s spike as another correction and re-expose the secular bear trend. A recovery above 73.05 would also reinforce a broader base/correction move higher

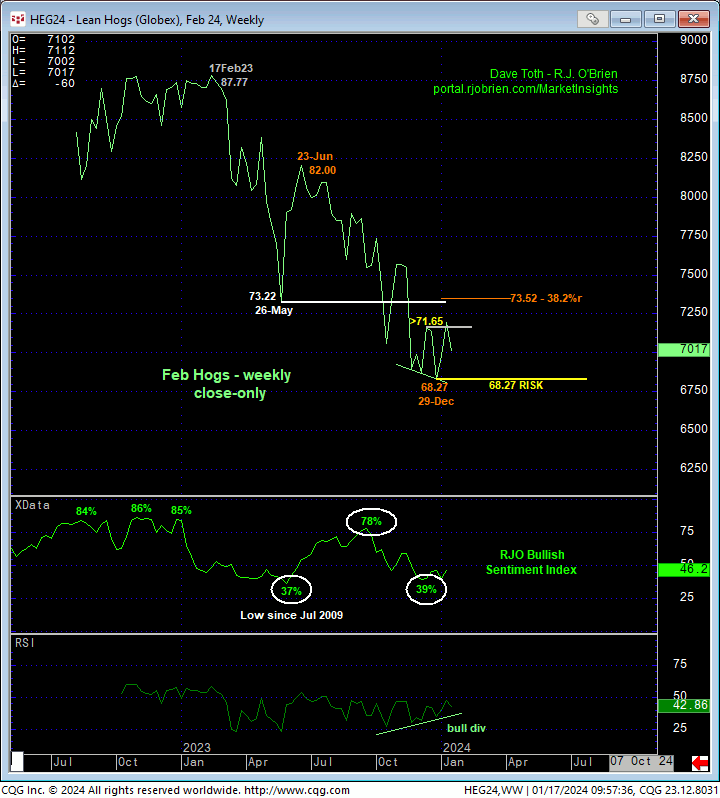
On a broader scale, the extent of early-Jan’s bounce remains well within the bounds of a mere correction versus the magnitude and dominance of the secular bear market that dates from Feb’23’s 87.77 weekly high close in the Feb24 contract. As a result of the important combination of a bullish divergence in WEEKLY momentum amidst historically bearish levels in our RJO Bullish Sentiment Index however, it would be premature to short-change a larger-degree correction or reversal higher until/unless the market nullifies this divergence by taking our early-Jan’s lows (64.57 intra-day, 68.27 weekly close).

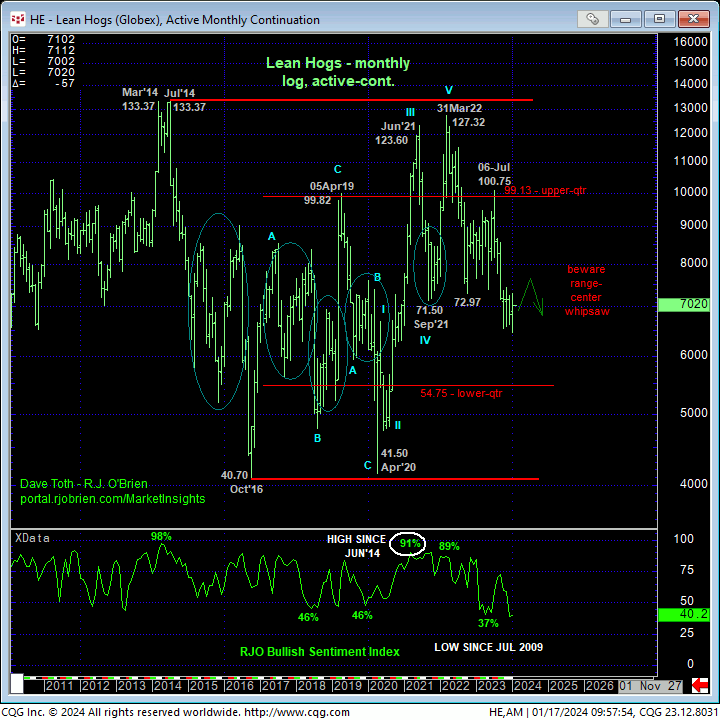
Lastly, complicating and challenging directional bets is the market’s continued residence deep, deep, deep within the middle-half bowels of its massive but lateral historical range where the odds of aimless whipsaw risk remain high, warranting a more conservative approach to directional risk assumption. Indeed, the monthly log active-continuation chart below shows brain-numbing, grotesque volatility and whipsaw behavior that DOMINATED THIS MARKET FOR FIVE YEARS from 2015 until 2020. Hitting a directional home run from these levels and conditions is like expecting the White Sox to win the pennant this year. Rather, a more conservative risk assumption approach of hitting singles and keeping risk parameters tight- like 73.05- we believe, is preferred as the odds of striking out are high.
These issues considered, a neutral-to-cautiously-bearish policy are advised with a recovery above 73.05 required to negate this call, warrant its cover and consider a cautious bullish stance. In lieu of such strength, further lateral-to-lower, and possibly much lower prices are anticipated in the period ahead.


