Posted on Aug 10, 2023, 09:42 by Dave Toth
Today’s clear break below last week’s 81.02 initial counter-trend low and, most importantly, 19-Jul’s 80.55 larger-degree corrective low and longer-term bull risk parameter reinforces our broader peak/reversal count introduced in 03-Aug’s Technical Blog and warns of further and possibly protracted losses straight away. This resumed weakness reaffirms 01-Aug’s 86.75 high as one of obvious developing importance and also defines Mon’s 86.07 high as the latest smaller-degree corrective high. This 86.07 high is the level this market is now minimally required to recoup render the sell-off attempt from 86.75 a 3-wave and thus corrective affair that would then re-expose May-Aug’s uptrend that preceded it. Until and unless such strength is shown, the current decline from 86.07 cannot be ignored as the dramatic 3rd-Wave of an eventual and potentially deep 5-ewave sequence down and resumption of the secular bear market from Mar’22’s 127.32 high. Per such, 86.07 and 86.75 serve as our new short- and long-term parameters from which the risk of non-bullish decisions like long-covers and new bearish punts can be objectively based and managed.
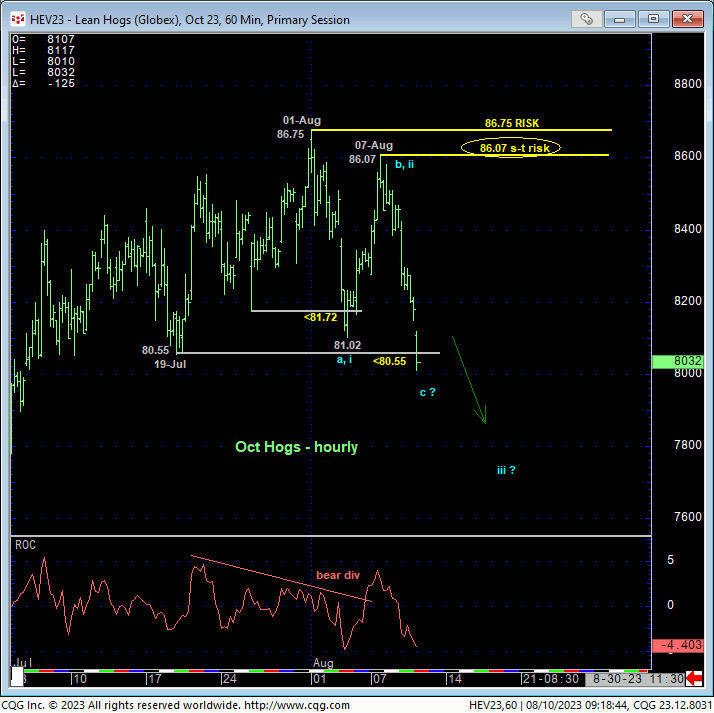
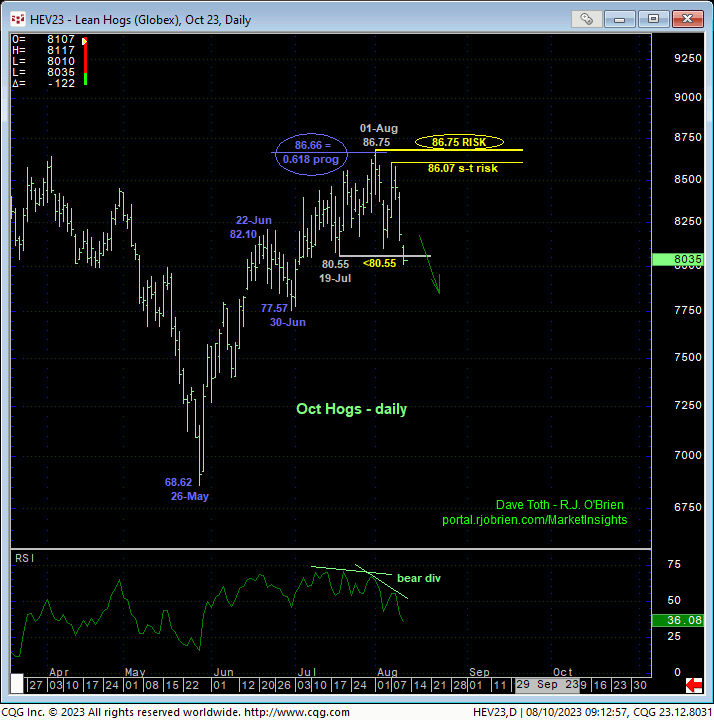
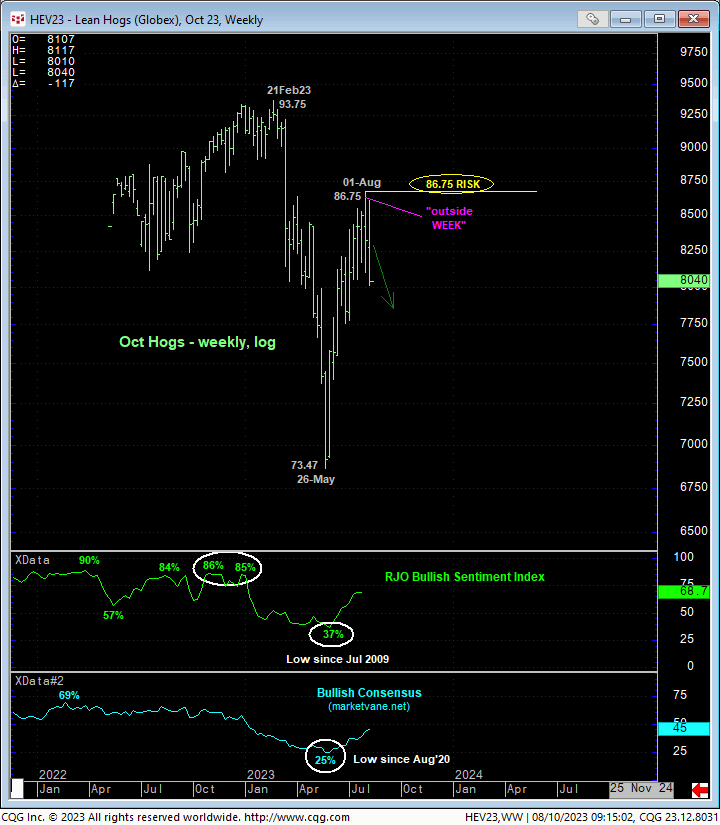
On a larger scale, today’s failure below 19-Juls 80.55 corrective low confirms a bearish divergence in daily momentum (above) that breaks the uptrend from 26-May’s 68.62 low. Might the current relapse be just a slightly larger-degree correction ahead of a resumption of May-Aug’s impressive rally? Sure. BUT IF this is the case, then somewhere along the line the market must arrest this decline with a countering bullish divergence in mo and recoup at least 86.07 and preferably 86.75. Until these conditions are met, there is no way to know that May-Aug’s recovery is a major BEAR market correction ahead of a resumption of Mar-Oct’22’s downtrend that preceded it. The (86.66) 0.618 progression of May-Jun’s 68.62 – 62.10 rally from 30-Jun’s 77.57 low and last week’s “outside WEEK down” would seem to contribute to a broader bearish count.
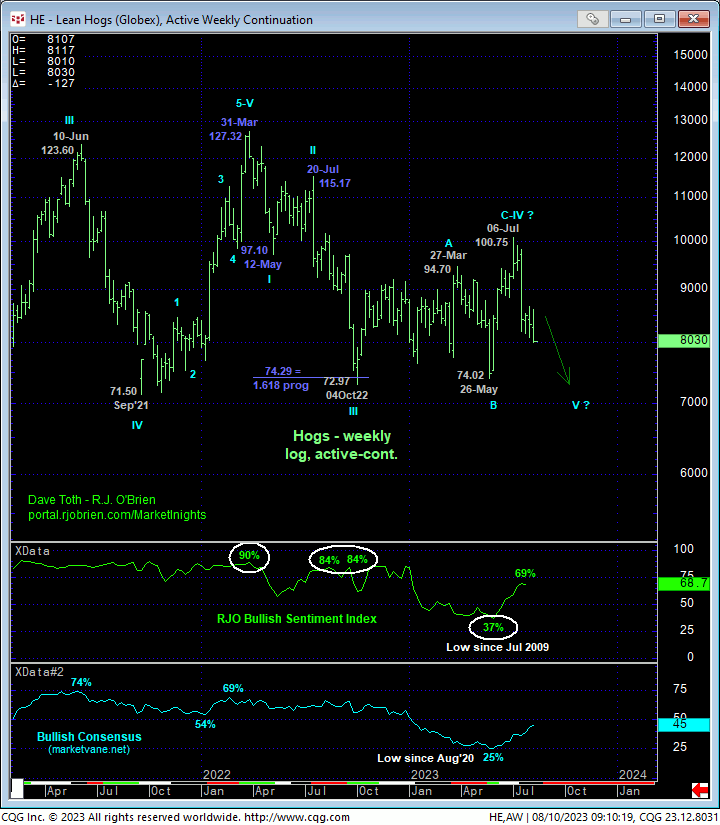
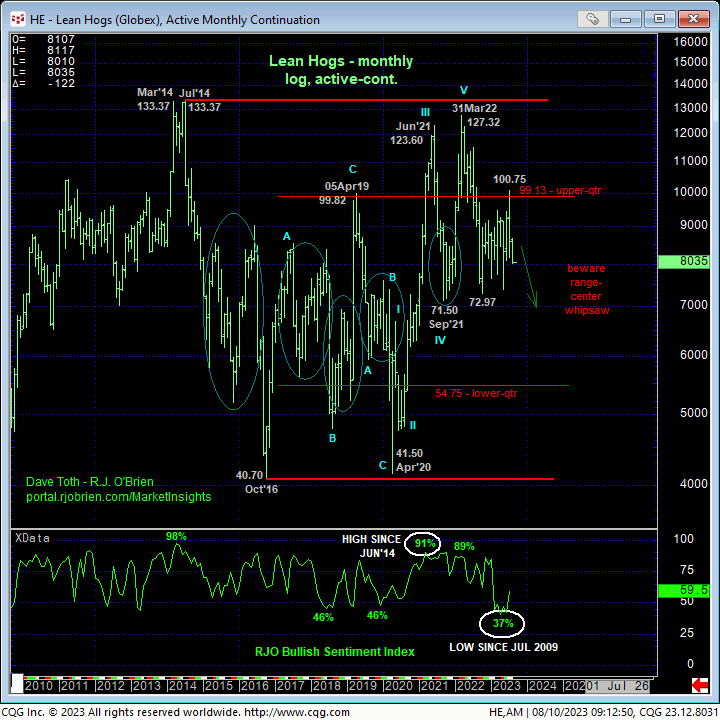
Additionally, on an active-continuation basis, the weekly (above) and monthly (below) log scale charts show the recovery attempt from last Oct’s 72.97 low to 06-Jul’s 100.75 high as a clear 3-wave and thus corrective structure that warns of a resumption of last year’s downtrend that preceded it. The market’s unsurprising rejection of the upper-quarter of its massive but lateral historical range also weighs against any longer-term bullish policy.
Granted, the market’s position still deep within the middle-half bowels of this historical range could leave it prone to further aimless chop like it has experienced since last Oct. But as a result of today’s momentum failure below 80.55, we now have a specific level at 86.75 that the market is required to recoup to mitigate a broader bearish count and resurrect a bullish one. Until and unless such strength is proven, a new bearish policy remains advised with recovery attempts advised to be approached as corrective selling opportunities ahead of potentially protracted losses that could span weeks or months.
In sum, a bearish policy and exposure are advised with a recovery above at least 86.07 and preferably 86.75 required to threaten and then negate this call and warrant defensive measures. In lieu of such strength, further and possibly protracted losses are expected.