Posted on Jan 09, 2024, 10:36 by Dave Toth
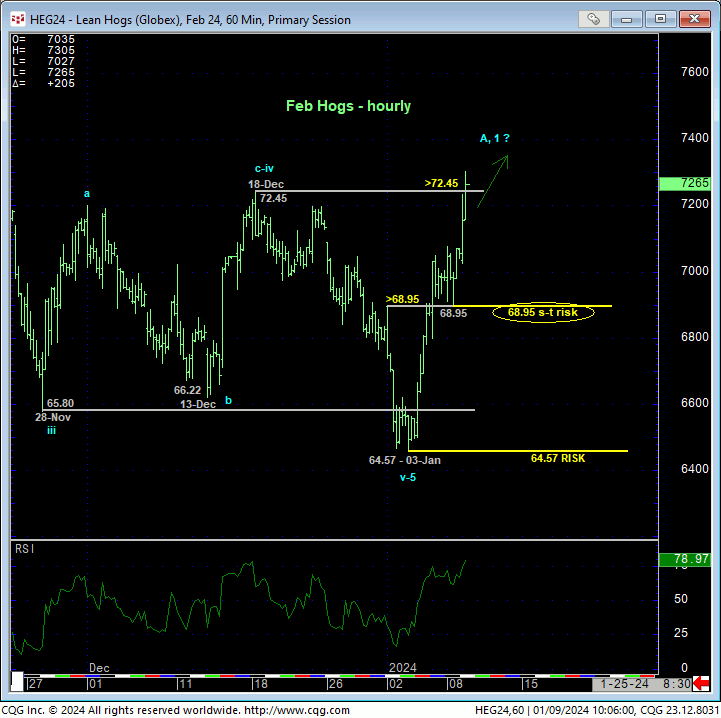
On the heels of Fri’s bullish divergence in short-term momentum above 02-Jan’s 68.95 smaller-degree corrective high discussed in Fri’s Technical Blog, the hourly chart below shows today’s continued gains above 18-Dec’s 72.45 larger-degree corrective high that, as we’ll discuss below, confirms a bullish divergence in WEEKLY momentum, exposing a larger-degree correction or reversal higher. The resulting by-products of this continued recovery are the market’s obvious definition of 03-Jan’s 64.57 low as one of developing importance and our new longer-term bull risk parameter as well as yesterday’s 68.95 low as a smaller-degree corrective low and new short-term parameter from which non-bearish decisions like short-covers and cautious bullish punts can be objectively rebased and managed. For longer-term reasons we’ll discuss below, traders are urged to keep a keen eye on upside momentum in the period immediately ahead, where a shorter-term failure below a tighter corrective low and bull risk parameter like 68.95 will prove very handy indeed.
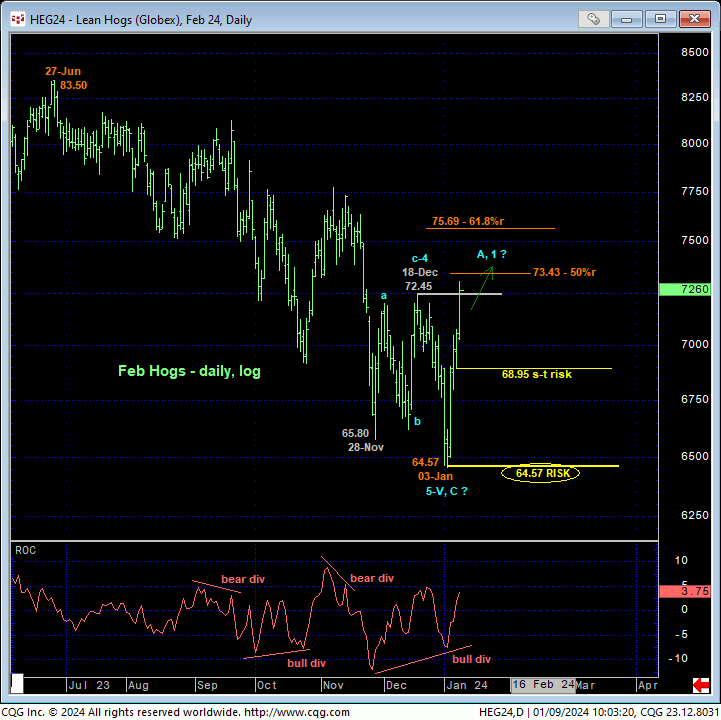
Stepping back, the daily log chart above and weekly close-only chart below of the Feb contract show the bullish divergence in weekly momentum as a result of today’s break above 18-Dec’s 72.45 larger-degree correction high and 15-Dec’s 71.65 corrective high weekly close (even though this week hasn’t closed yet). This larger-degree momentum failure at least threatens the broader downtrend from late-Jun’s high(s), the various Fibonacci retracements of which are noted.
Given the magnitude of a new secular bear market that arguably dates from Mar’22, it would be premature to conclude a major reversal higher as a result of only a week’s rebound. Indeed, the close-only chart below shows the Feb contract still below former 73.220-area support from last May that, since broken, now serves as a key resistance candidate. AND EVEN IF the past week’s impressive, impulsive spike is just the initial A- or 1st-Wave of a much more protracted correction or reversal higher, we must be on the lookout for a countering B- or 2nd-Wave corrective rebuttal to this initial countertrend rally that would be typical of broader base/correction/reversal PROCESSES. Herein lies the importance of an admittedly smaller-degree corrective low and short-term risk parameter like 68.95. Per such, traders are urged to approach this current rally cautiously and suspiciously as the market engages the 73/74-handle-area.
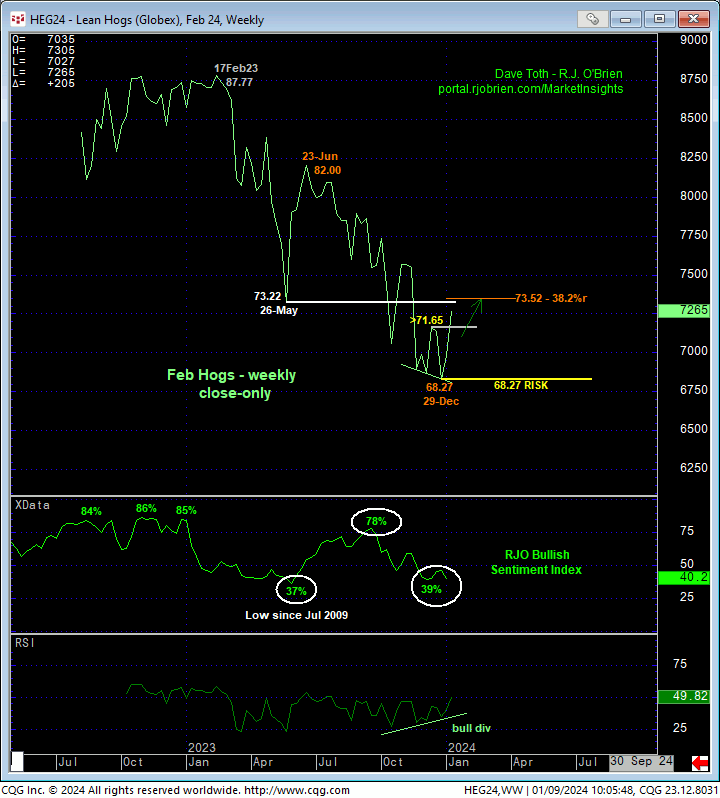
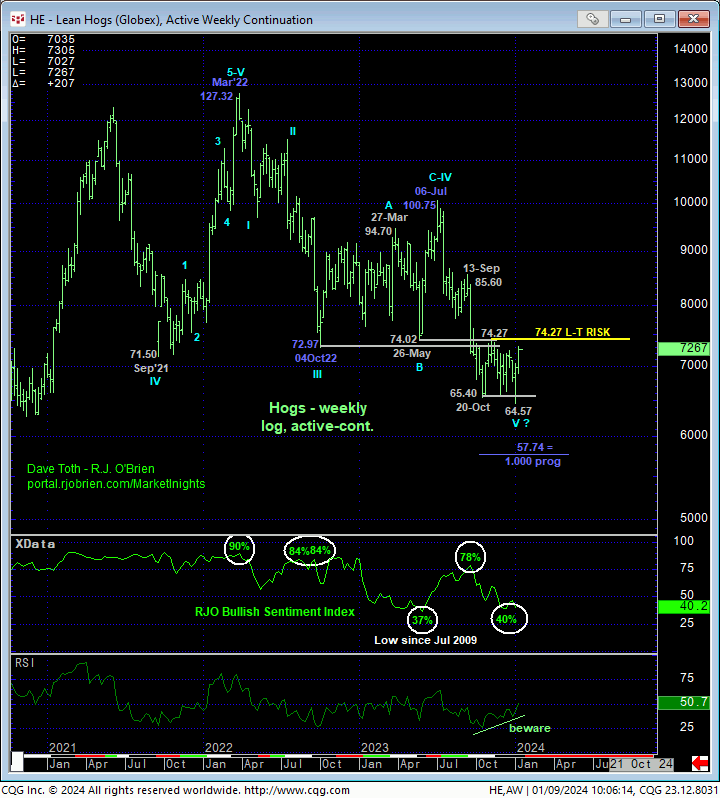
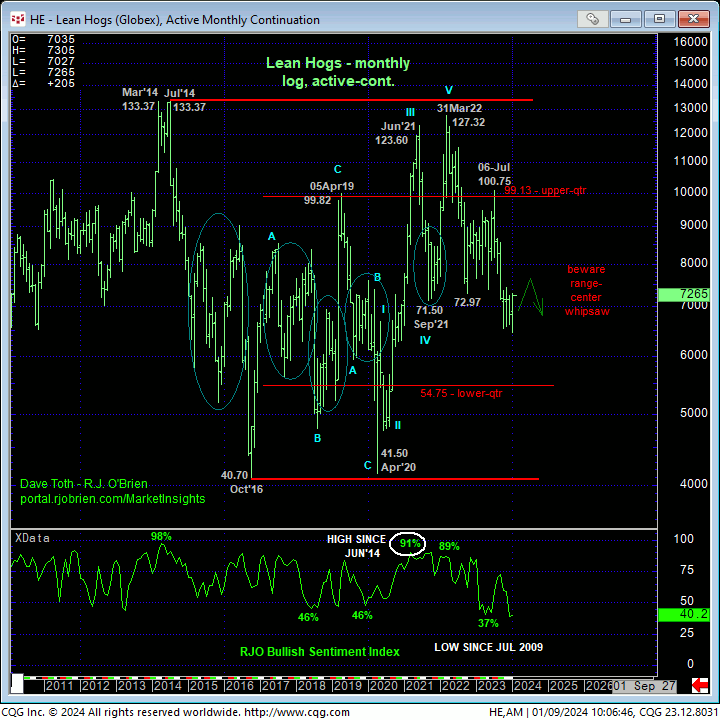
On an active-continuation basis, the weekly (above) and monthly (below) log scale charts show the magnitude of the past 2-1/2-YEARS’ peak/reversal process and start of a new secular bear market we believe is akin to that that followed 2014’s major top. The weekly chart shows a hugely important area of former support around the 73-handle-area that, since broken in Oct, now serves as a key new resistance candidate. To reinforce and expose a more protracted correction or reversal higher, we believe this market needs to take out at least early-Nov’s 74.27 high in the prompt contract.
Additionally, and as we’ve been discussing ad nauseum for months, the market’s position deep, deep within the middle-half bowels of its massive but lateral historical range maintains the odds of aimless whipsaw risk that could prove similar to the aimless and very volatile chop that dominated this market for FIVE YEARS from 2015 to 2020. Under these range-center circumstances, we believe the odds of hitting a directional home run are poor, warranting a more conservative approach to directional risk assumption that highlights smaller-degree corrective lows like 68.95.
These issues considered, all previously recommended longer-term bearish exposure has been nullified and a neutral/sideline policy is advised for the time being as “chasing” new bullish exposure on the past week’s prospective initial counter-trend rally “up here” are poor.
