Posted on Jul 25, 2022, 10:39 by Dave Toth
The now-prompt Oct contract’s slip today below Fri’s 94.70 minor corrective low confirms a bearish divergence in short-term momentum. This is an admittedly very minor mo failure at best, but nonetheless defines today’s 97.07 high as one of developing importance and possibly the end of the portion of this month’s not unimpressive rally from 05-Jul’s 86.82 low. Per such and for some increasingly important longer-term reasons discussed below, we’re defining 97.07 as our new short-term risk parameter from which non-bullish decisions like long-covers and cautious bearish punts can be objectively based and managed by shorter-term traders with tighter risk profiles.
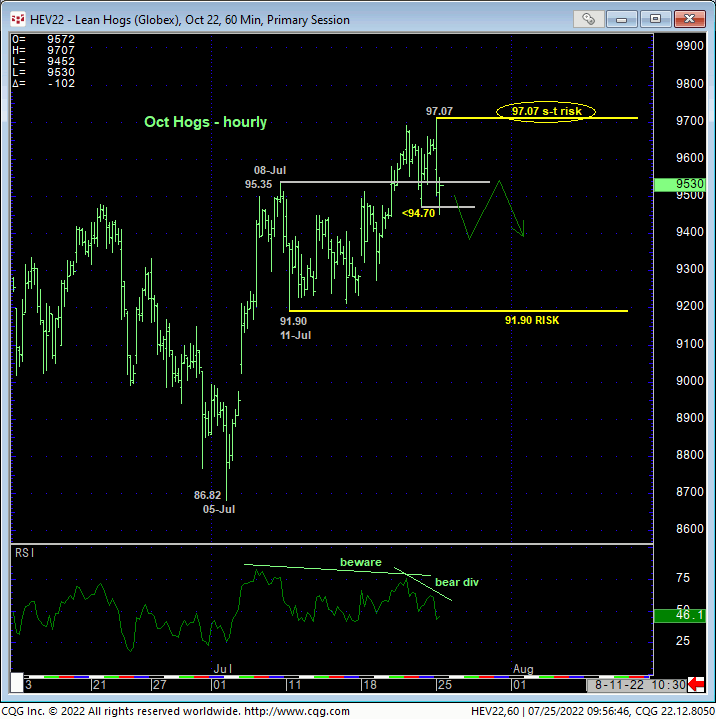
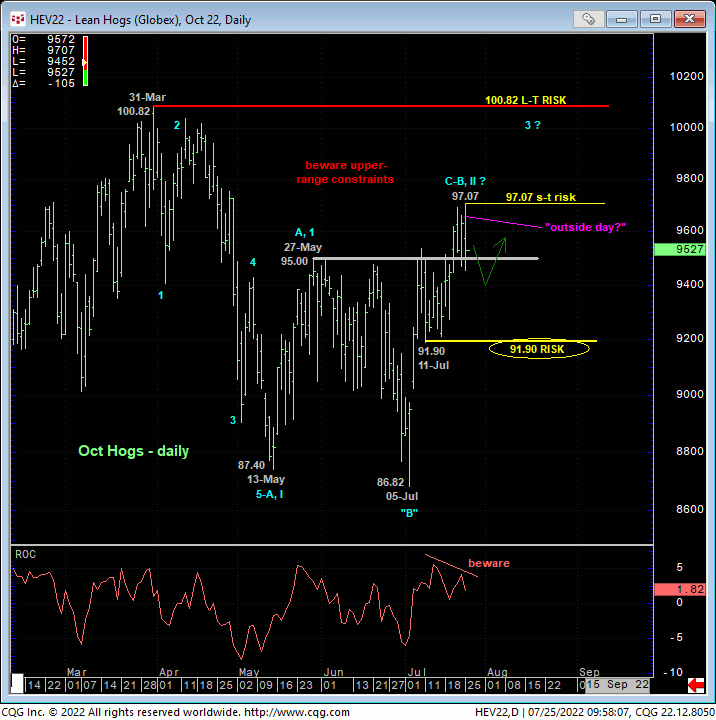
On a broader scale, the daily high-low chart above and close-only chart below shows last week’s clear break ABOVE a month-and-a-half’s resistance from the 94.50-to-95.00-area. This larger-degree-but-still-intra-2022-range strength has 11-Jul’s 91.90 intra-day low and/or 12-Jul’s 92.45 low close as its larger-degree corrective low. We’re defining these levels as pivotal long-term bull risk parameters this market MUST sustain gains above to maintain a broader bullish count.
From a geeky Elliott Wave perspective, the past couple weeks’ rally from those 11-Jul and/or 12-Jul lows is likely only one of two things: the dramatic 3rd-Wave of the resumed secular bull trend OR the completing C-Wave of a (B- or 2nd-Wave) correction of Mar-May’s initial (A- or 1st-Wave) decline). The former, bullish count would be characterized by sustained, trendy, impulsive and increasingly obvious price action to the upside. The latter, bearish count would be expected to arrest this month’s recovery with a momentum failure below those 11- and 12-Jul larger-degree corrective lows.
As stated above, today’s minor mo failure below 94.70 is of too small a scale to CONCLUDE a larger-degree failure below 92.45 and/or 91.90. But until today’s 97.07 high is taken out, this market is:
- working on an “outside day down”
- has encroached on the upper quarter of this year’s range
- is following a 5-wave initial counter-trend decline from 31-Mar’s 100.82 high to 13-May’s 87.40 low (which, theoretically at least, means that decline is either the 1st-Wave start of a major reversal or the A-Wave start to a more protracted correction lower)
- coming off a bearish divergence in WEEKLY momentum, with
- our RJO Bullish Sentiment Index returning to frothy 82% levels.
Per these technical facts, it’s not hard to envisions and, indeed, consider this month’s recovery as the completing c-Wave of a major (B- or 2nd-Wave) correction of Mar-May’s decline as labeled in the daily charts above and below. If this ultimately bearish count is wrong, then we would expect the market to sustain recent gains above former 95.00-to-94.50-area resistance-turned-support and prove increasingly obvious trendy, impulsive behavior higher. Weakness, initially, below 94.50 will threaten such a bullish count while a failure below the 11/12-Jul lows will negate it, reinforce our major peak/reversal count, and expose potentially severe weakness below the 86-handle.
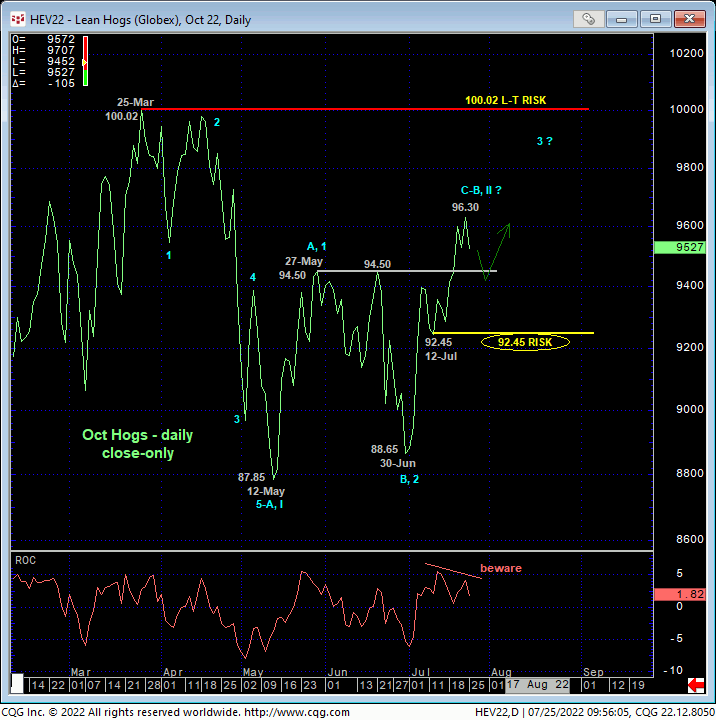
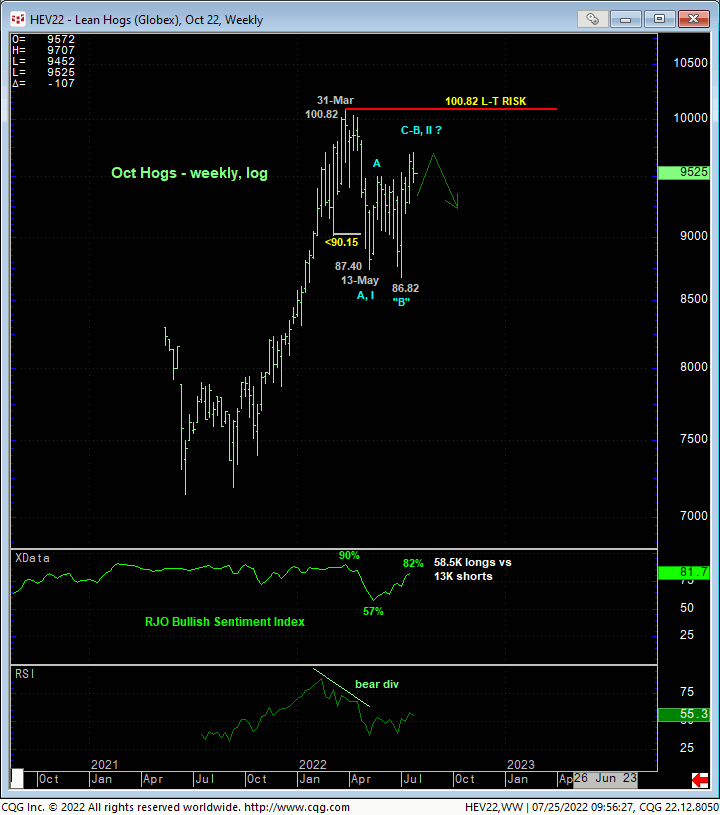
The weekly log chart of the Oct contract (above) shows early-May’s bearish divergence in momentum amidst what was historically frothy sentiment/contrary opinion levels. Until and unless 31-Mar’s 100.82 high is taken out, a major peak/reversal PROCESS remains as valid a count as any, with the market’s recent return to the upper recesses of this range leaving it particularly vulnerable. To maintain a longer-term BULLISH count and policy “up here, it is absolutely imperative that this market BEHAVE LIKE A BULL by sustaining trendy, impulsive behavior higher. Today’s short-term bearish divergence in mo is hard to ignore as an early threat to this bullish count, but this would/could be easily dismissed by a recovery above 97.07. Conversely, further erosion below roughly 94.50 would be the next strike against a longer-teem bullish count. A sub-91.90 failure would be strike 3.
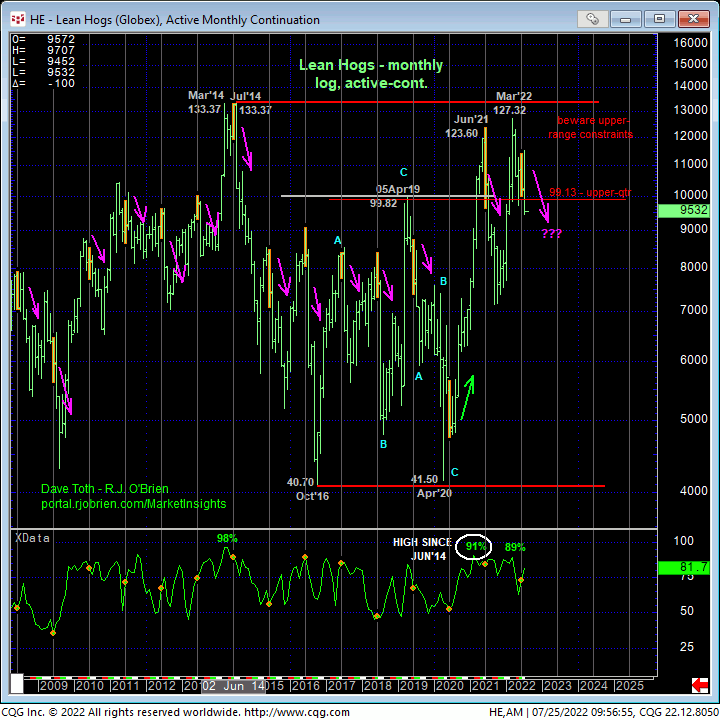
Finally and still in play as a contributing component to a major peak/reversal environment is this market’s proclivity for trading lower, and often times much lower, in the months following Jun/Jul. The monthly log active-continuation chart below, which is now reflecting Oct contract prices, shows that this market traded lower in 13 of the past 14 years. COMBINED with the other peak/reversal-threat elements listed above, it’s not hard to envision this market not only threatening the risk/reward merits of a bullish policy “up here”, but also being vulnerable to what could be protracted losses in the months ahead.
These issues considered, shorter-term traders are advised to move to a neutral/sideline position with a recovery above 97.07 required to negate this call, re-expose the bull and warrant a return to a cautious bullish stance. Longer-term commercial players remain OK to maintain a bullish policy and exposure with a failure below 94.50 required to pare exposure to more conservative levels and commensurately larger-degree weakness below 91.90 to jettison all remaining exposure. Longer-term players also have the option of acknowledging and accepting whipsaw risk, back above 97.07, in exchange for deeper nominal risk below 94.50 and/or 91.90.
