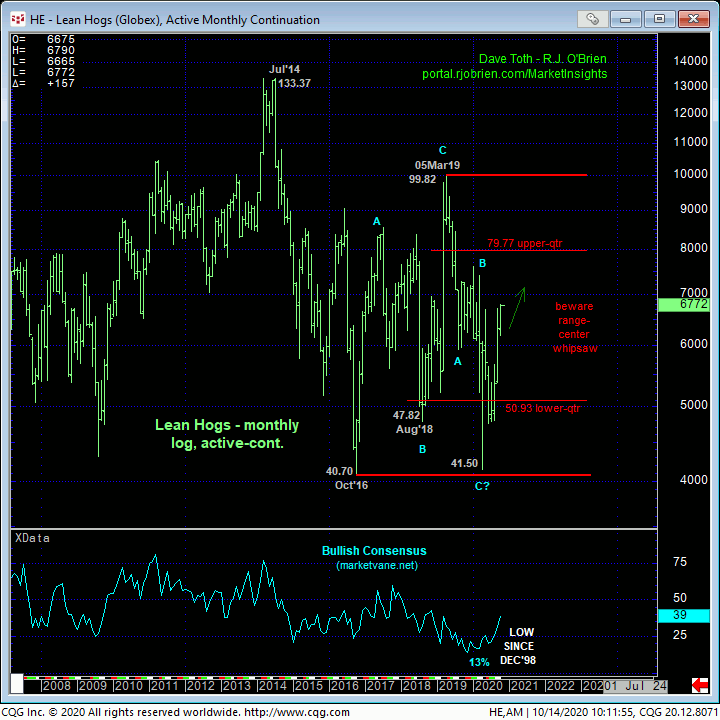
This morning’s break above last week’s 67.45 high reaffirms this year’s major reversal and leaves smaller- and larger-degree corrective lows in its wake at 64.90 and 61.25, respectively, that the market is now required to fail below to threaten and then negate the clear and present and major bull. Per such, these levels represent our new short- and long-term risk parameters from which a still-advised bullish policy and exposure can be objectively rebased and managed. As the hourly chart below shows, a failure below 64.90 will confirm a bearish divergence in short-term momentum of a scale sufficient for shorter-term traders to pare or neutralize bullish exposure and circumvent the depths unknown of at least a correction of the portion of the major bull trend from 16-Sep’s 61.25 low.
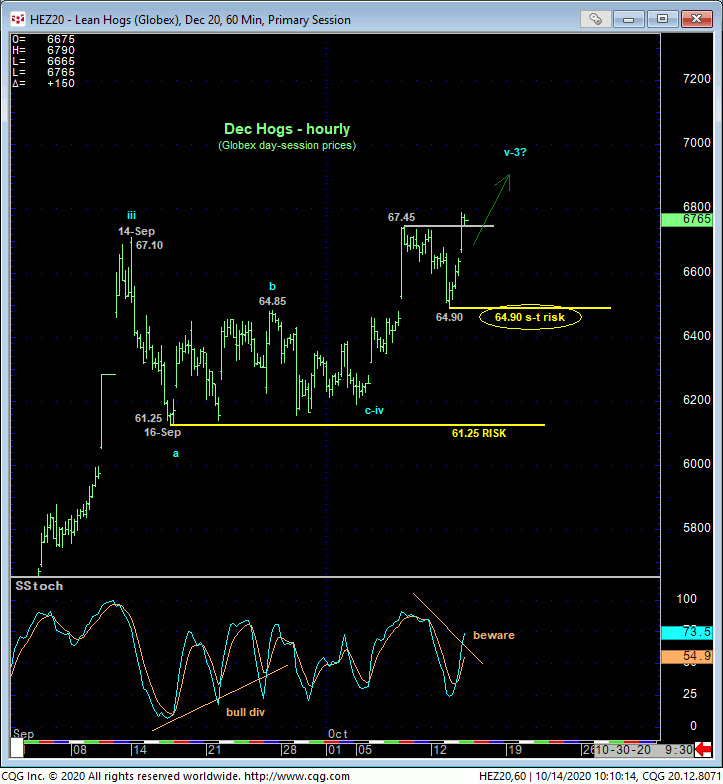
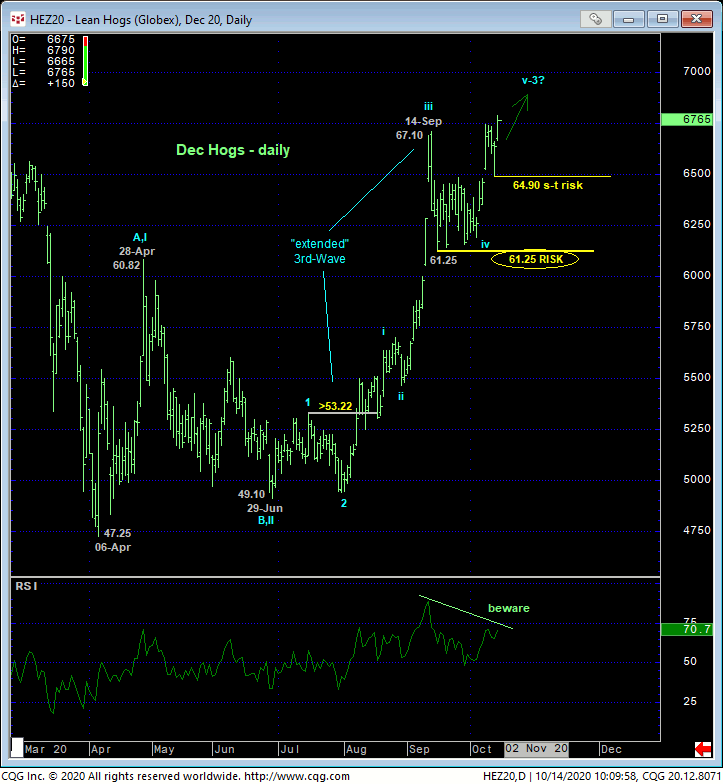
Needless to say, such smaller-degree weakness below 64.90 would be of an insufficient scale to conclude anything more than another interim corrective hiccup within the major uptrend shown in the daily chart above and weekly chart below of the Dec contract. Commensurately larger-degree weakness below 61.25 remains required to confirm a momentum failure of a scale sufficient to, in fact, break the 4-month uptrend from 29-Jun’s 49.10 low. What could lie between these two 64.90 and 61.25 thresholds is a large-degree (4th-Wave) correction/consolidation ahead of a sequence-completing (5th-Wave) rally to one final round of new highs. But we can only address that bridge if/when the market takes us there with a sub-64.90 failure. Until such weakness is proven, the trend is up on all practical scales and should not surprise by its continuance or acceleration.
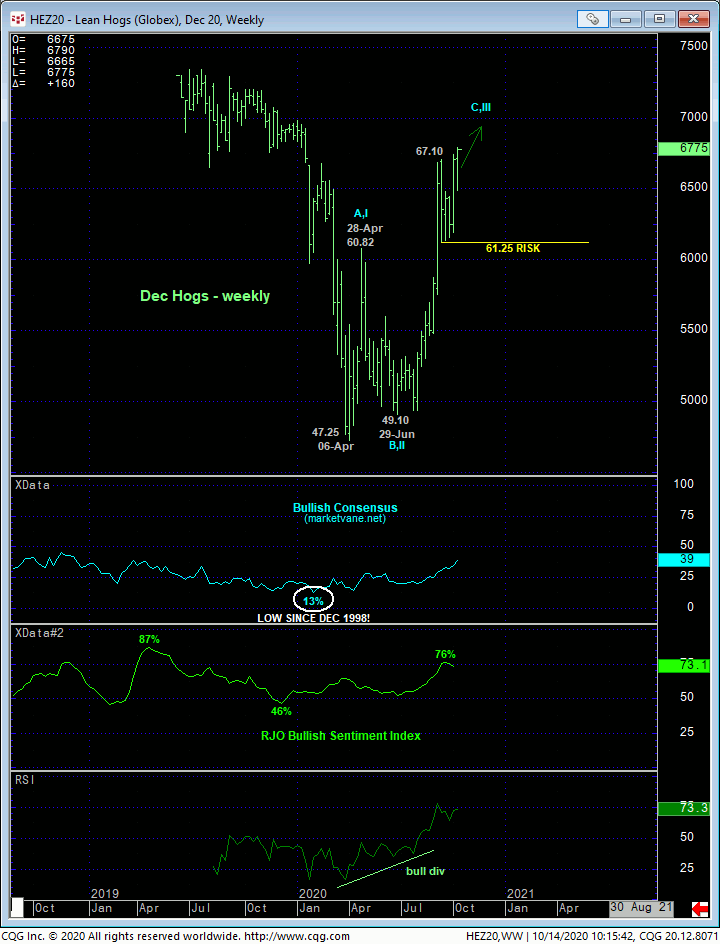
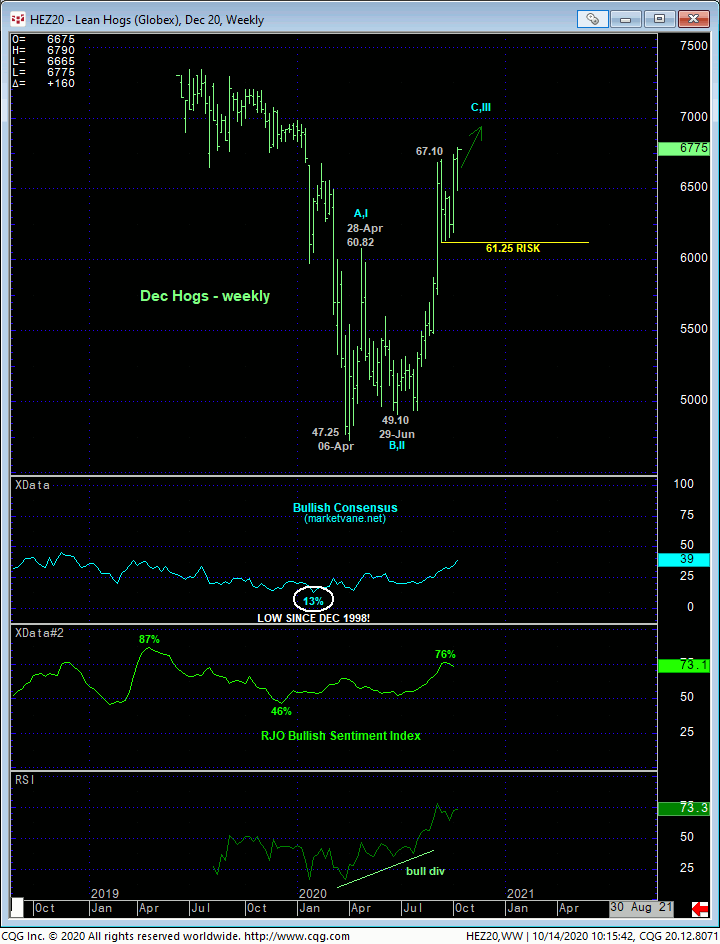
Trying to find flies in the bullish ointment, the weekly (above) and monthly (below) log scale active-continuation charts show the market back deep within the middle-half bowels of the past FOUR YEAR range where the market has experienced considerable whipsaw risk over this time. Additionally, both measures of market sentiment/contrary opinion we scrutinize closely- the Bullish Consensus (marketvane.net) and our proprietary RJO Bullish Sentiment Index of the hot Managed Money positions reportable to the CFTC- have recovered to frothy levels not seen since those that warned of and accompanied 2Q19’s major peak/reversal. Market sentiment is certainly at levels typical of major peak/reversal environments. However, traders are reminded that sentiment/contrary opinion is not an applicable technical tool in the absence of an accompanying confirmed bearish divergence in momentum needed to at least stem the clear and present uptrend. Herein lies the importance of corrective lows and specific risk parameters like 61.25 and even 64.90.
These issues considered, a full and aggressive bullish policy and exposure remain advised with a failure below 64.90 required for shorter-term traders with tighter risk profiles to neutralize exposure and circumvent the depths unknown of another interim correction or a more protracted reversal lower. Commensurately larger-degree weakness below 61.25 is required for longer-term commercial players to follow suit. In lieu of such weakness, further and possibly accelerated gains should not surprise straight away with former 67-handle-area resistance expected to hold as new near-term support.
