Posted on Jan 03, 2024, 06:50 by Dave Toth
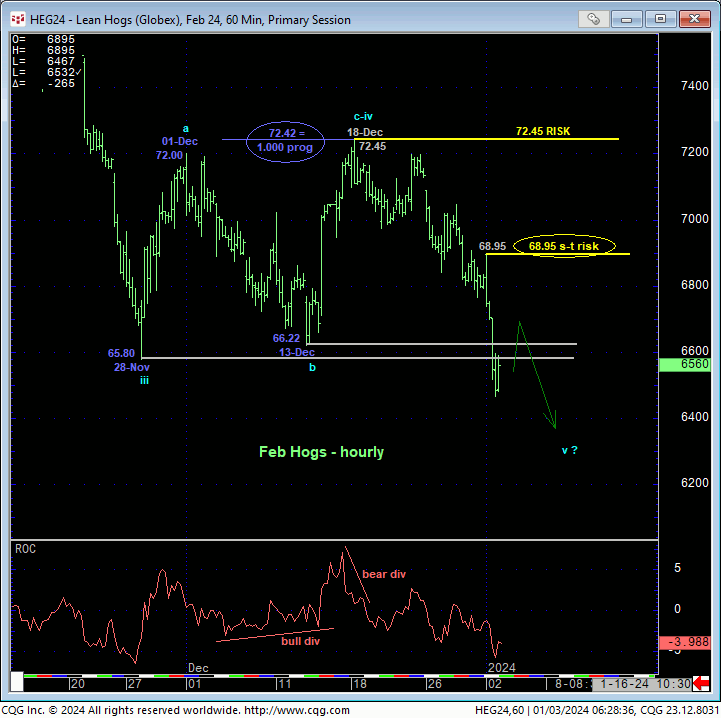
Yesterday’s clear break below the past month’s lows and support around the 66.22-to-65.80-area reaffirms and reinstates the major bear trend following 26-Dec’s bearish divergence in short-term momentum discussed in 27-Dec’s Technical Blog and leaves yesterday’s 68.95 high in its wake as the latest smaller-degree corrective high this market is now minimally required to recoup to even defer, let alone threaten the secular bear trend. Per such, we’re defining this 68.95 level as our new short-term parameter from which shorter-term traders can objectively rebase and manage the risk of a still-advised bearish policy and exposure.
The former and general 66-handle-area support would be expected to hold as new near-term resistance, but as we’ll discuss below, the market’s position still deep within the middle-half bowels of its historical range maintains odds of aimless whipsaw risk and volatility. Herein lies the importance to shorter-term traders of identifying corrective highs and objective risk parameters like 68.95.
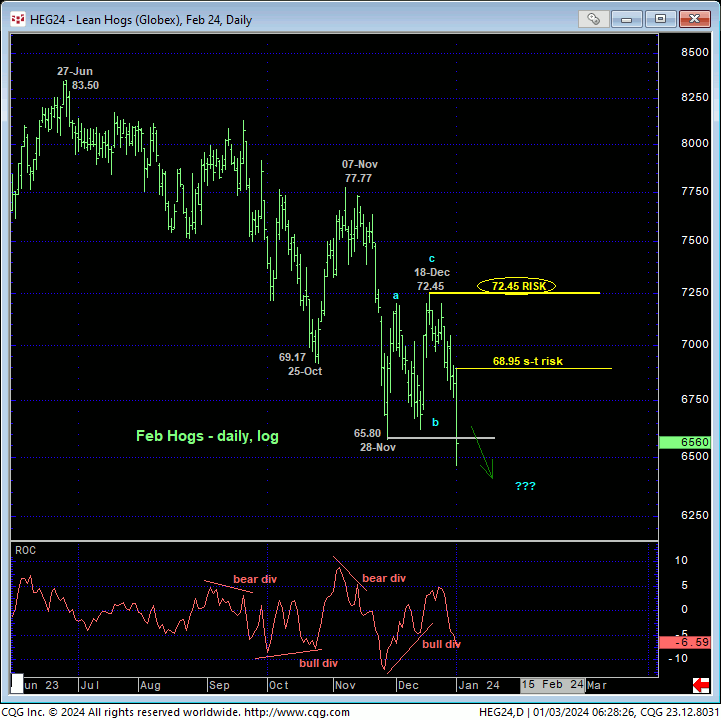
On a broader scale, only a glance at the daily log chart above and weekly close-only chart below of the Feb contract is needed to see the clear and present and major downtrend. To negate this trend, commensurately larger-degree strength above 18-Dec’s 72.45 intra-day high and/or a weekly close above 15-Dec’s 71.65 corrective high weekly close remains required. While the bludgeoning this market has taken remains clear, a massive peak/reversal that is now nearly TWO YEARS in scope, the intra-month and even intra-week challenge remains volatility. Indeed, the downtrend from Jun’s 83.50 has been anything but smooth, with jagged, volatile corrective spikes within the overall downtrend more the norm than the exception. Herein lies the importance of technical and trading SCALE and adhering to risk parameters commensurate with one’s personal risk profile and why we try to identify both smaller- and larger-degree risk parameters like 68.95 and 72.45.
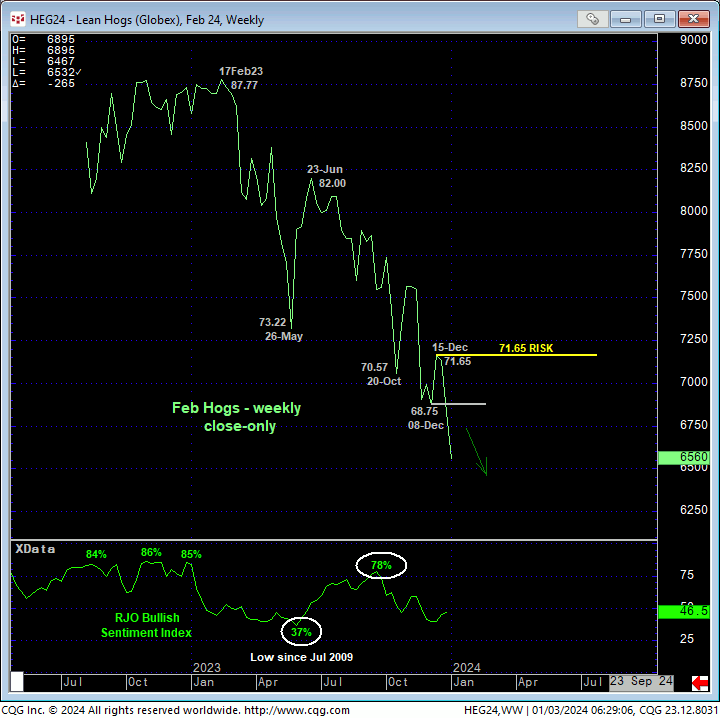
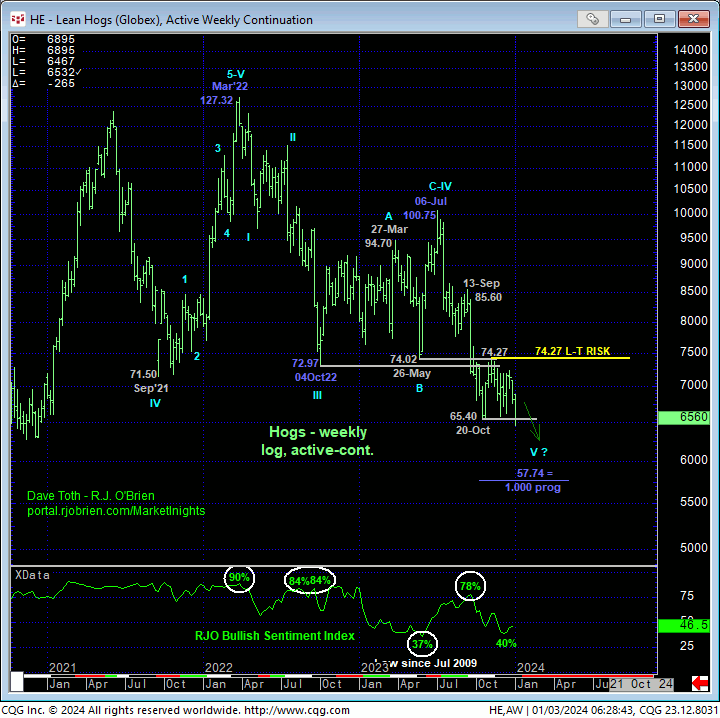
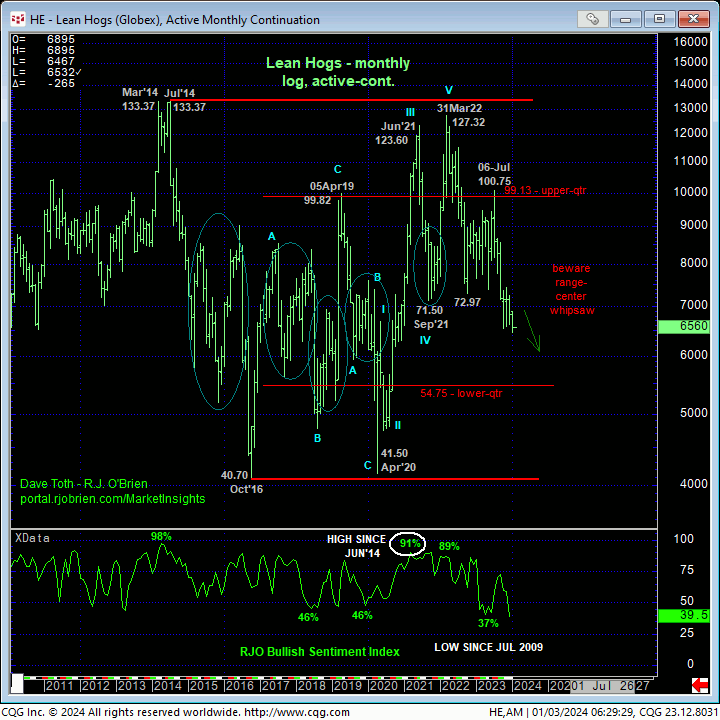
On an active-continuation basis, the weekly (above) and monthly (below) log scale charts show this week’s continuation of the secular bear market from Mar’22’s 127.32 high. The trend is down on all scales and should hardly surprise by its continuance or acceleration with the ultimate goal of the lower-quarter of its historical range below 55-cents.
HOWEVER…..the monthly chart also shows the market deep within its massive but lateral historical range that has been fertile ground for tremendous aimless whipsaw risk and high volatility. The trek to the lower-quarter of this historical range may be a harrowing one indeed, as it was for YEARS between 2015 and 2020. Again, herein lies the crucial importance of identifying corrective highs and bear risk parameters on both a smaller- and larger-degree in order to reduce the risk of interim spikes that may be egregiously steep.
In sum, a bearish policy and exposure remain advised with a recovery above 68.95 sufficient for shorter-term traders to step aside and commensurately larger-degree strength above 72.45 for longer-term commercial players to follow suit. In lieu of such strength, further and possibly accelerated losses are expected.
