
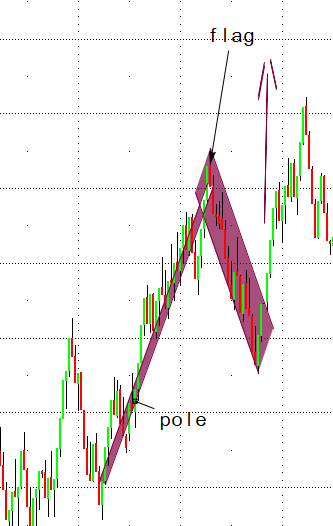
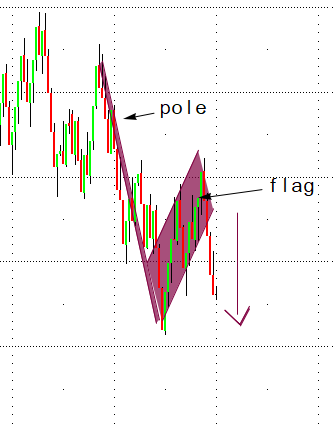
Here is How to identify market potential continuation patterns using the “ flag” formation on the chart. The two parts to any flag are the pole which is the primary trend, and the consolidation pattern, which is the flag. The Flag formations on the chart helps to identify a market movement to the upside or downside visually. I like using Range Bars for charting to see the trend clearly, please reach out to me if you want to learn more about that or have a question about it. Here are two examples, one bull pattern flag and one bear pattern flag formations.
Bull Flag:
Bear Fag:
You can see these patterns on a long term as well as short term charts. As always, it is beneficial to also consider the underline fundamentals of supply/demand to make sure that both the technical and the fundamentals analysis are in sink. If you have any question about this or any other technical set ups reach out to me directly 1800-367-7290 or email me: etesfaye@rjofutures.com
DISCLAIMER:
The risk of loss in trading futures and/or options is substantial and each investor and/or trader must consider whether this is a suitable investment. Past performance, whether actual or indicated by simulated historical tests of strategies, is not indicative of future results.
