DEC COPPER
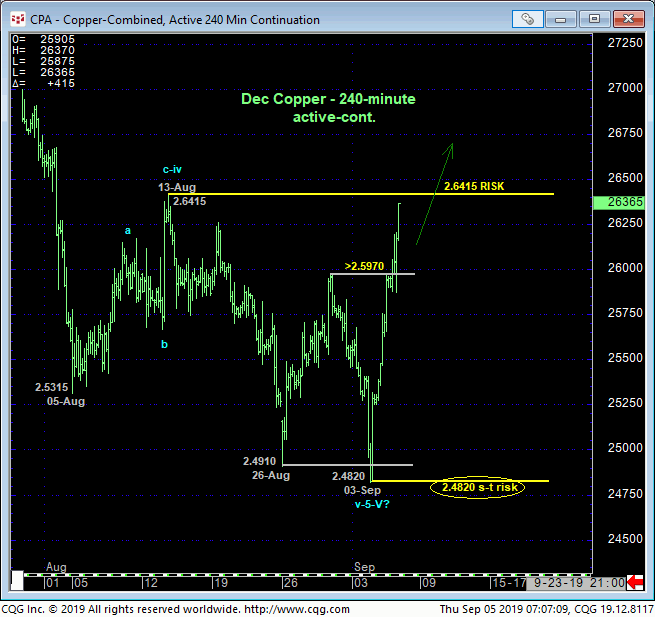
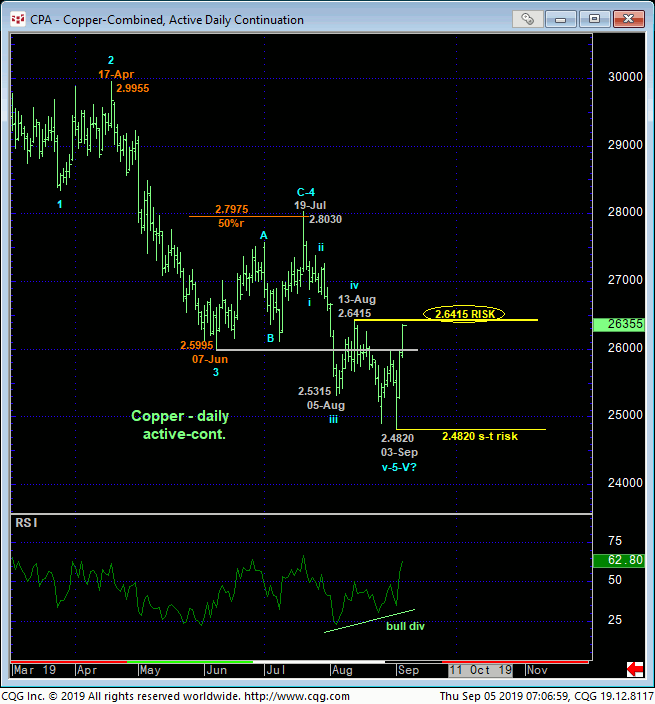
While the market has yet to recoup 13-Aug’s 2.6415 larger-degree corrective high and our key risk parameter needed to conclude the end of the downtrend from 19-Jul’s 2.8030 high, the extent and impulsiveness of the past couple days’ recovery is so impressive that we’re concluding a bullish divergence in daily momentum from overnight’s recovery above 29-Aug’s 2.5970 smaller-degree corrective high and our short-term risk parameter. Ancillary factors contribute to this bullish count and what we believe is a developing base/reversal-threat environment that could be major in scope, including:
- an arguably complete 5-wave Elliott sequence down from 19-Jul’s 2.8030 high
- the market inability to sustain Aug losses below early-Jun’s 2.5995-area support-turned-resistance
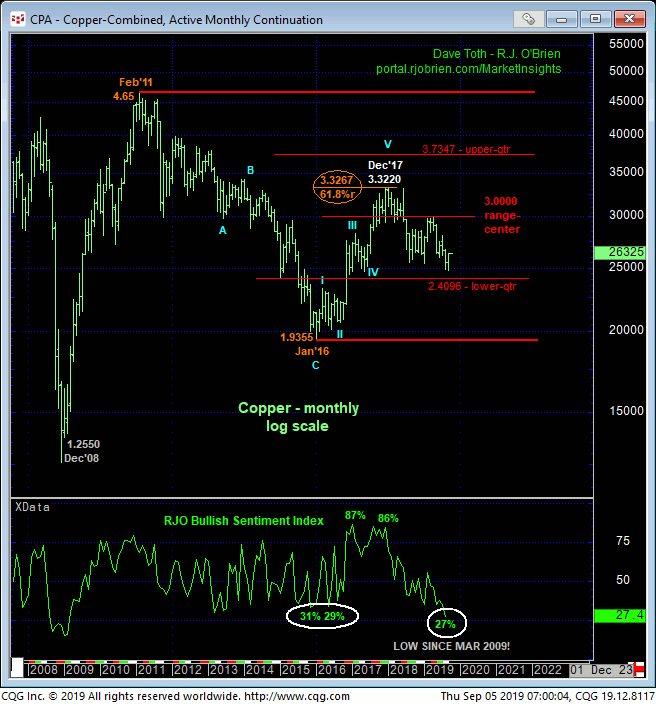
- the prospect that the broader decline from Dec’17’s 3.305 high weekly close is a complete, major 5-wave Elliott sequence as labeled below in which
- the suspected 5th-Wave down from Feb’s 2.9515 high spanned a length 61.8% (i.e. 0.618 progression) of the net distance of Waves-I-thru-III from 3.3005 to 2.6225
- historically bearish levels in our RJO Bullish Sentiment Index,
Indeed, the current 27% level in our RJO Bullish Sentiment Index of the hot Managed Money positions reportable to the CFTC is the most egregiously bearish position in over 10 YEARS. COMBINED with these other base/reversal threat factors, this sentiment/contrary opinion factor warns of potentially extensive upside vulnerability that could span months or even quarters.
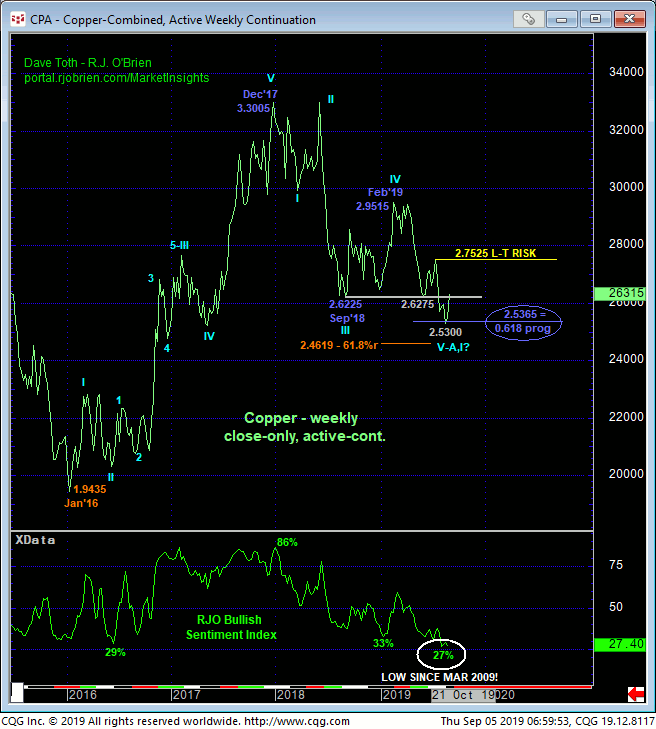
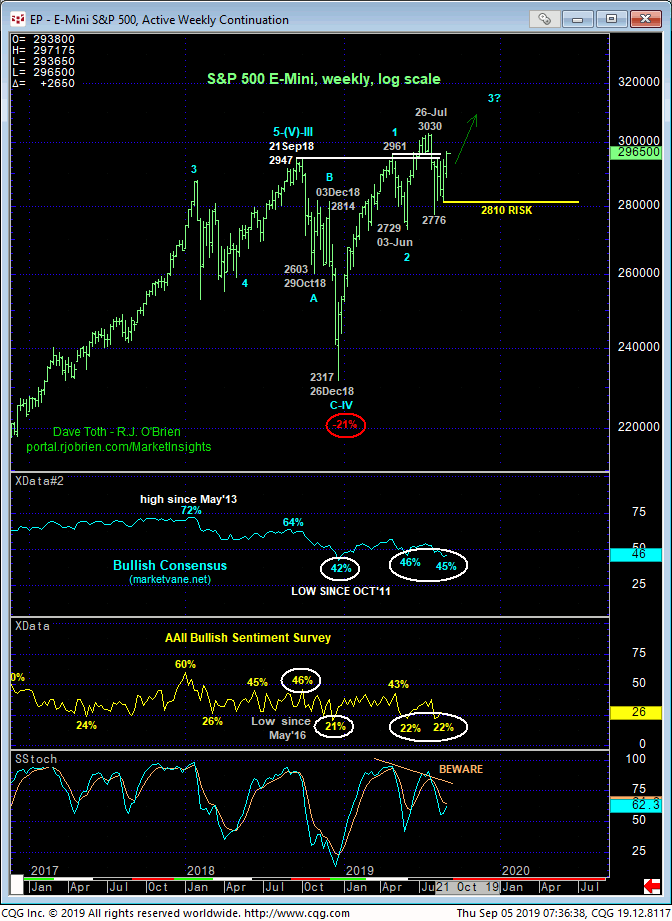
To be sure, commensurately larger-degree strength above 19-Jul’s 2.8030 intra-day high (or a weekly close above 19-Jul’s 2.7525 corrective high) remains required to break even this year’s downtrend, let alone the downtrend from Dec’17’s 3.3005 high. But until and unless this market weakens below Tue’s 2.48320 low and short-term but pivotal risk parameter, we believe this market’s in the early days of a base/correction/reversal-threat environment that not only could be major in scope, but also would be a considerabvle reinforcing factor to a bullish count in the S&P 500 discussed below.
In sum, traders are advised to move to a neutral/sideline position if they haven’t done so already and to first approach relapse attempts as corrective buying opportunities within a base/reversal process that could have longer-term implications. We will zero in on such suspected corrective relapses after the market stems this initial counter-trend rally. “Chasing” this initial counter-trend rally for bullish exposure presents poor risk/reward merits.
SEP E-MINI S&P
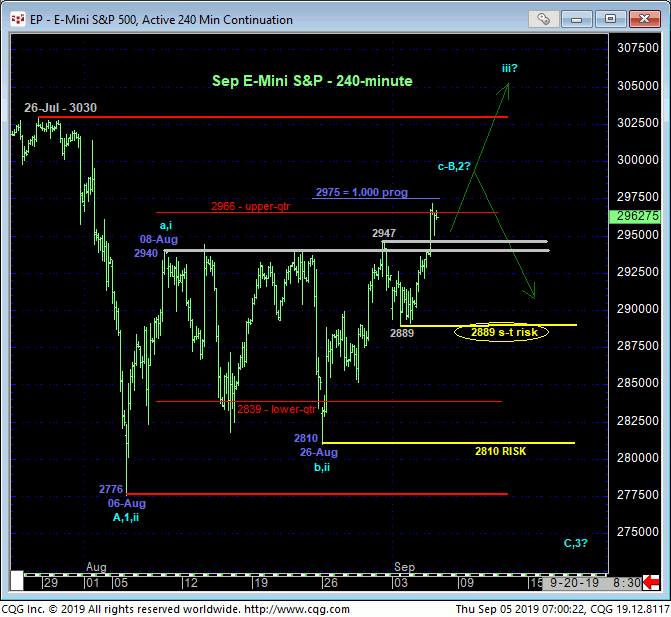
Today’s poke above the past MONTH’S resistance from the 2940-to-2947-area reinforces our bullish count discussed in Tue’s Technical Blog and leaves Tue’s 2889 low in its wake as not only the latest smaller-degree corrective low and new short-term risk parameter, but also, arguably, this market’s single most important technical level in our opinion. For IF today’s bust-out above the past month’s 2940-to-2947-area resistance is part of the resumption of the secular bull market to new all-time high, then we would fully expect the market to now sustain these impulsive gains above at least now-former 2947-to-2940-area resistance-turned-support and certainly Tue’s 2889 corrective low. Given the fact that 26-Jul’s 3030 all-time high remains intact as a key resistance candidate, such a sub-2889 failure would raise the odds that the entire recovery attempt from 06-Aug’s 2776 low is a 3-wave and thus corrective affair within a broader peak/correction/reversal process that would warn of a relapse below 2776.
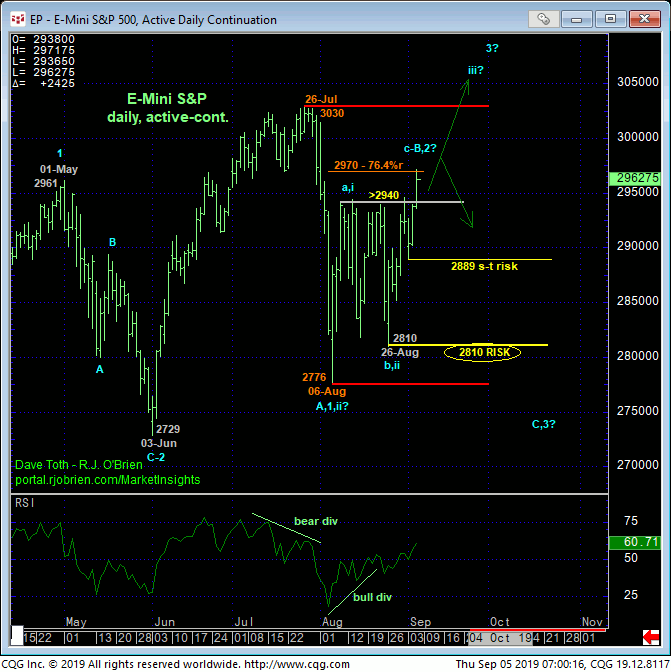
Indeed, the daily chart below shows the current recovery flirting with the (2970) 76.,4% retrace of Jul-Aug’s 3030 – 2776 decline as well as the (2975) 1.000 progression of early-Aug’s 2776 – 2940 rally from 26-Aug’s 2810 corrective low detailed in the 240-min chart above. With 26-Jul’s 3030 high and resistance still intact, we cannot ignore an alternate bearish count that contends the past month’s recovery is just a (B- or 2nd-Wave) correction within a broader peak/reversal threat. Per such we’ve described this current area as the “rubber-meets-the-road zone”. IF 06-Aug’s 2776 low completed a correction, then the secular bull has to “perform” here and now with proof of continued trendy, impulsive behavior higher. A failure below 2889 would NOT be consistent with such a bullish count and required performance and would resurrect a broader peak /reversal threat.
Reinforcing a bullish count is the fact that sentiment/contrary opinion indicators are wafting around historic LOWS typical of the ends of major downside corrections or reversals, not when a market is within spittin’ distance of all-time highs. We could understand such hyperbole stemming from recession talk and tariffs and Iran and Brexit, etc., if the market was getting its brains bashed in like last Oct/Dec’18. But “UP HERE”, so close to all-time highs, history would suggest that such pessimism is unlikely to be rewarded. Moreover, this pessimism could leave the market VULNERABLE to accelerated gains as the secular bull to 3030+ levels resumes. This week’s stunning recovery amidst other bullish factors in the copper market would seem to be an important reinforcing element to a bullish count in S&Ps.
These issues considered, a bullish policy remains advised with a failure below 2889 required to threaten this count enough to warrant moving to the sidelines. In lieu of such sub-2889 weakness, further and possibly accelerated gains should not surprise, with former 2947 – 2940-area resistance considered new near-term support.
