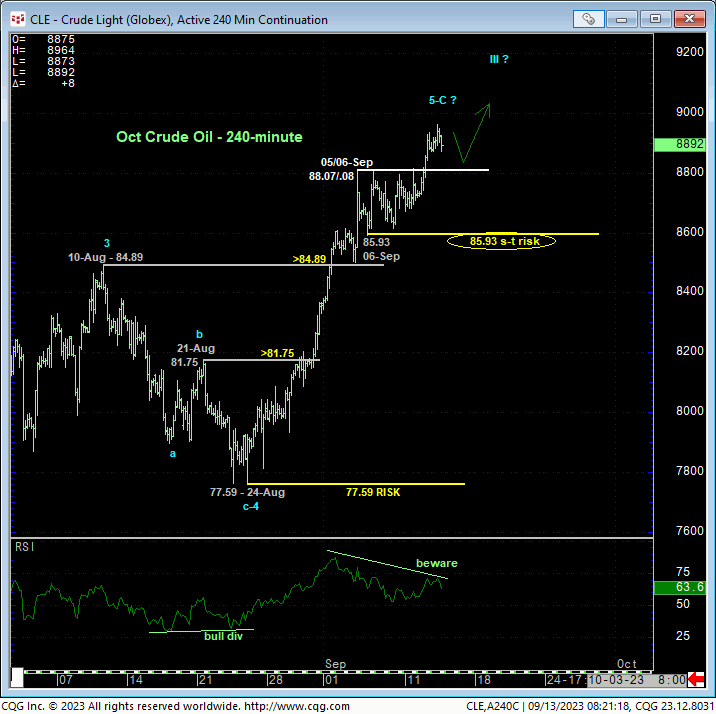
Posted on Sep 13, 2023, 08:47 by Dave Toth
Yesterday’s clear, impulsive break above last week’s 88.07/.08-area resistance reaffirms this year’s major recovery and our bullish count introduced in 05-Jul’s Technical Blog. This continued strength leaves 06-Sep’s 85.93 low in its wake as the latest smaller-degree corrective low and new short-term parameter from which the risk of a still-advised bullish policy and exposure can be objectively rebased and managed. The 240-min chart below also shows the now-former area of resistance around the 88.00-area as a key new support candidate.
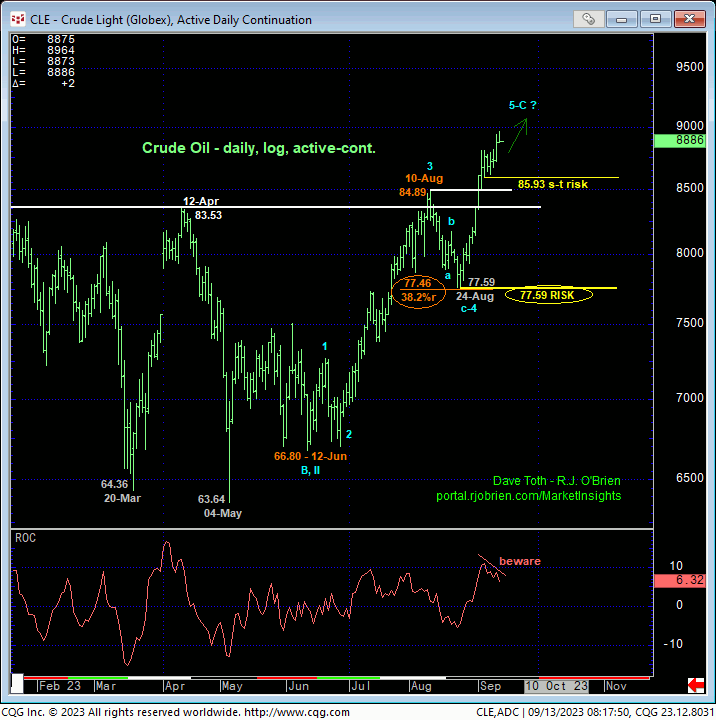
On a broader scale, the daily log chart above clearly shows the continued impressive, impulsive uptrend from 12-Jun’s 66.80 low that requires commensurately larger-degree weakness below 24-Aug’s 77.59 larger-degree corrective low to break. Per such, this 77.59 low remains intact as our key long-term bull risk parameter pertinent to longer-term commercial players. And should the market confirm a smaller-degree momentum failure below 85.93, there’s a ton of former resistance-turned-support between 10-Aug’s 84.89 high and 12-Apr’s pivotal 83.53 high that capped the lateral range that dated from last Dec until last month’s upside breakout. As 24-Aug’s 77.59 “obvious” bull risk parameter is admittedly quite a way away, even for longer-term commercial players, a failure below the 83-handle may be considered an intermediate-term risk parameter that could/would warrant paring exposure to more conservative levels.
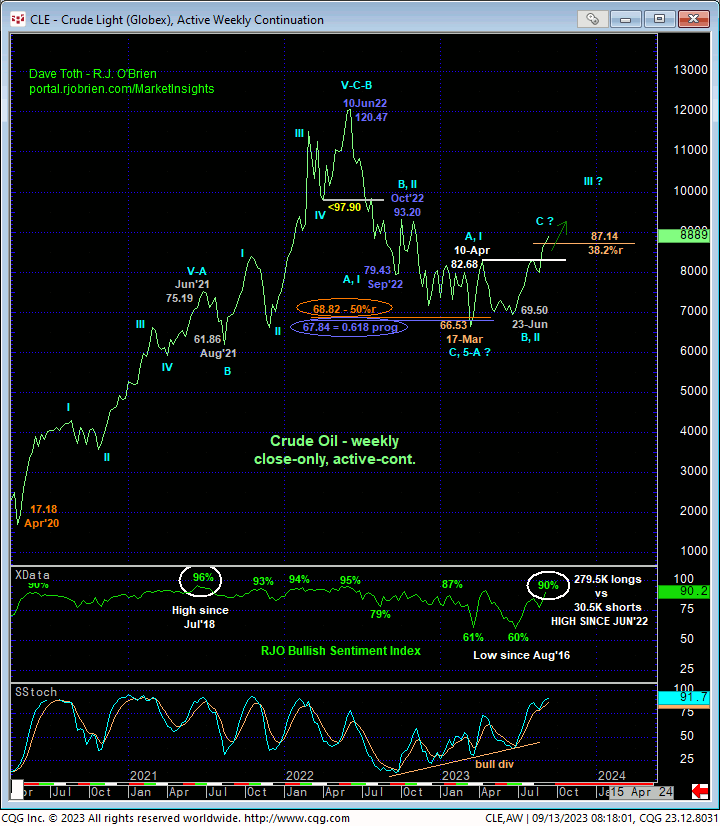
From an Elliott Wave perspective, might the rally from 24-Aug’s 77.59 low be the completing 5th-Wave of the sequence up from 12-Jun’s 66.80 low that might also complete a major 3-wave correction up from mid-Mar’s 66.53 low weekly close shown in the weekly log chart below? Yeah, sure. HOWEVER, we can ONLY navigate such a broader peak/reversal-threat process AFTER this market confirms a bearish divergence in momentum of a scale sufficient to expose such a prospect. And a failure below 06-Sep’s 85.93 is NOT of such a sufficient scale. As a result, the trend is up on all practical scales and should not surprise by its continuance or acceleration straight away.
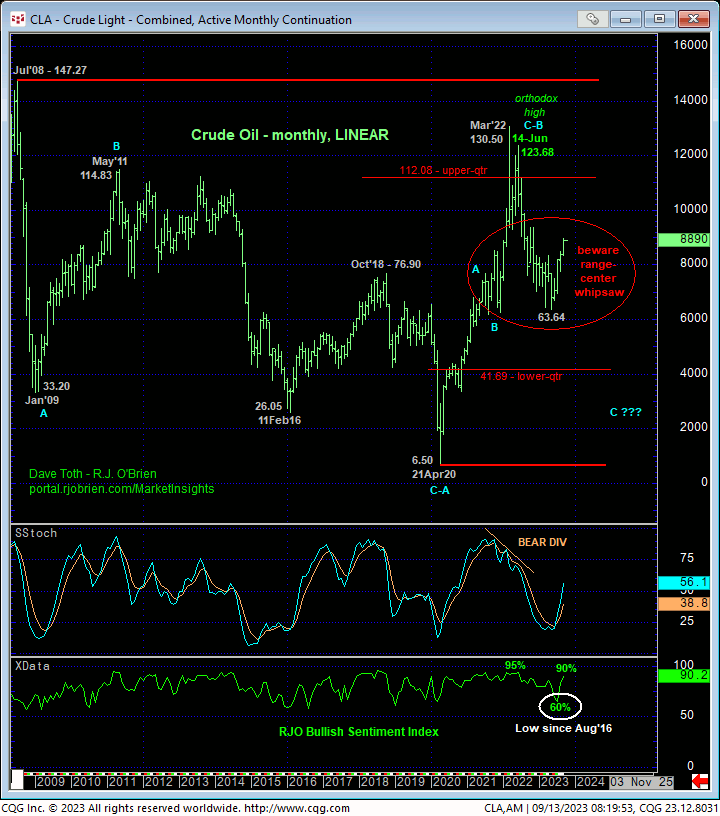
Lastly, and on an even broader scale, the monthly chart below shows this market still deep, deep within the middle-half bowels of its massive but lateral historical range where the odds of aimless whipsaw risk are approached as higher, warranting a more conservative approach to directional risk assumption. Herein lies the importance of identifying (bull) risk parameters at 77.59 and even 85.93. This said and given the magnitude of Jun’22 – Mar’23’s near-50% meltdown, the recovery from Mar’23’s low remains well within the bounds of a mere (B- or 2nd-Wave) CORRECTION ahead of an eventual resumption of last year’s bear to eventual new lows below $63. Until and unless arrested by a countering bearish divergence in momentum however, this correction or rally or recovery or whatever one wants to call it as plenty of room to run where we believe upside potential should be considered indeterminable and potentially extreme.
These issues considered, a bullish policy and exposure remain advised with a failure below 85.93 required for shorter-term traders to take profits and move to the sidelines and commensurately larger-degree weakness below at least the 83-handle for longer-term commercial players to pare or neutralize exposure. In lieu of such weakness, further and possibly accelerated gains should not surprise straight away.