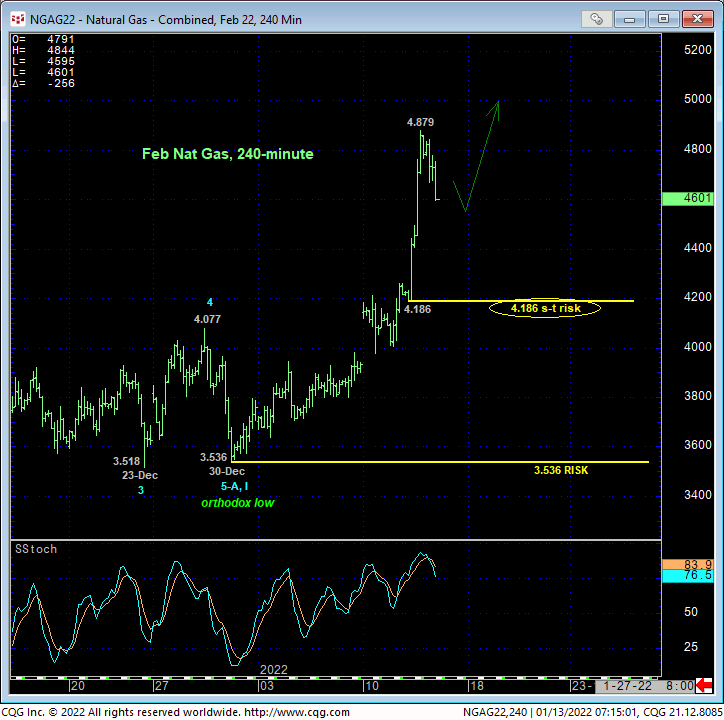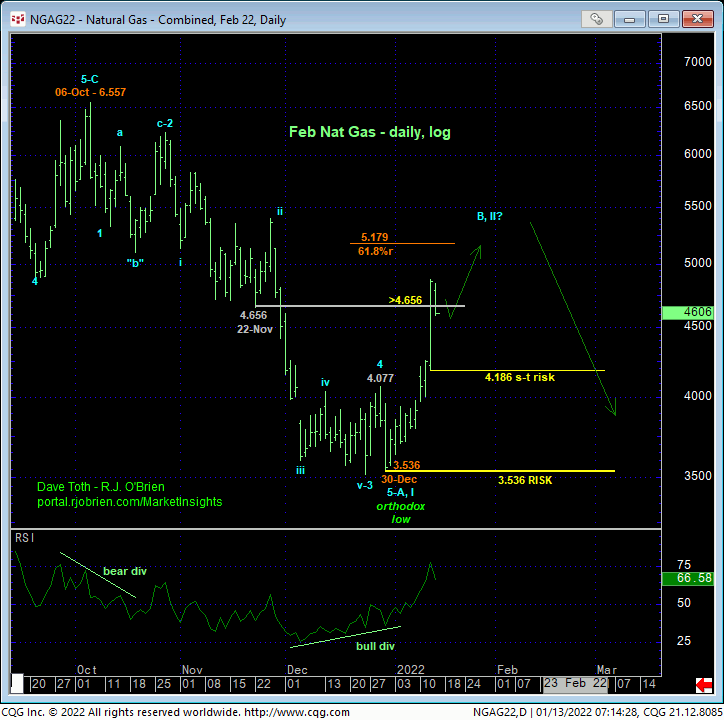

The extent of this month’s recovery, highlighted by yesterday’s accelerated stage above late-Nov’s 4.656-area support-turned-resistance, is too long in the proverbial tooth to be considered a smaller-degree corrective 4th-Wave within a still-developing 5-wave Elliott sequence down from 06-Oct’s 6.557 high. Per such, we’re acting on the still-long-term peak/reversal premise that 30-Dec’s 3.536 low is the end of just the initial A- or 1st-Wave of a major peak/reversal process from last year’s 6.557 high and that this month’s recovery is part of the not uncommon more extensive B- of 2nd-Wave corrective rebuttal within that process.
Such “more extensive” corrective rebounds this early in peak/reversal processes typically retrace 61.8% or more of the initial counter-trend break. In this case, that retracement of Oct-Dec’s 6.557 – 3.536 decline cuts across at 5.179. It’s crucial to understand that this merely derived Fibonacci levels is NOT considered resistance. We approach all such derived technical levels as “areas of interest” where we keep a keener eye on the only technical indicator used to navigate the ends of trends: MOMENTUM.
In both the 240-min chart above and the daily chart below, it is clear that this market has momentum to the upside currently. In fact, this momentum is arguably accelerating with a failure at this point below yesterday’s 4.186 low minimally required to jeopardize the impulsive integrity of this clear and present uptrend and reject/define a more reliable high and resistance form which a resumed bearish policy and exposure can only then be objectively rebased and managed. In lieu of such a confirmed bearish divergence in mo, further lateral-to-higher levels are anticipated in the period ahead.

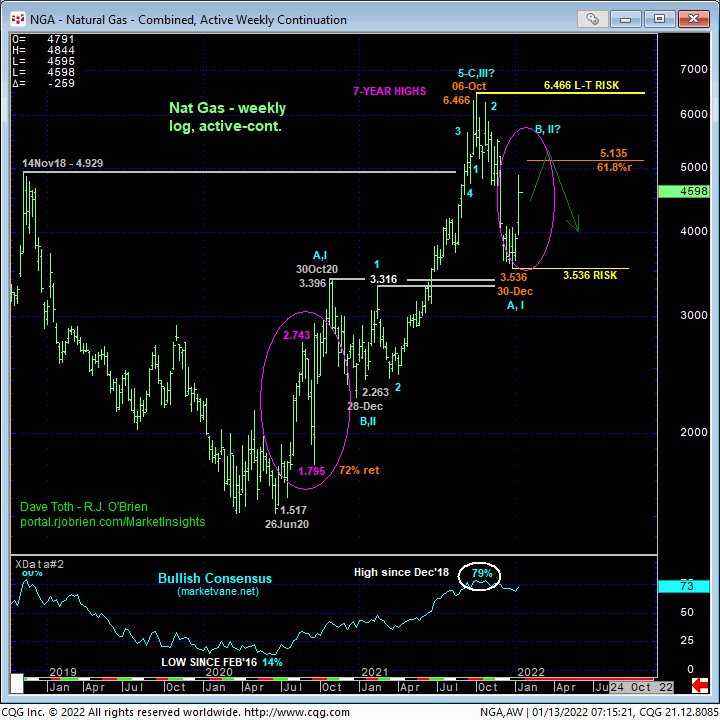
On a broader basis, it’s worth revisiting longer-term reversal processes that show the often-times extensive B- or 2nd-wave corrections that rebut initial A- or 1st-wave counter-trend moves as it takes TIME and price action to reverse the elements that drove the previous major trend. For instance, the weekly log active-continuation chart above chart below shows a sharp, extensive 72% correction of Jun-Aug’20’s initial A- or 1st-Wave counter-trend rally within that major base/reversal process. We believe this month’s recovery is the same thing, only inverted, within a major peak/reversal process that requires commensurately larger-degree strength above Oct’21’s 6.466 high on an active-continuation basis to negate.
Against this backdrop however, and with at least the intermediate-term trend clearly as up, we cannot conclude the end of this recovery until and unless the market stems this uptrend with a bearish divergence in momentum. It is this factor that we have our eyes peeled for in the week or two immediately ahead. Until and unless upside momentum wanes and then is confirmed with a failure below a prior corrective low, the market’s upside potential between spot and Oct’s 6.557 high in the Feb contract is indeterminable and should not be underestimated.

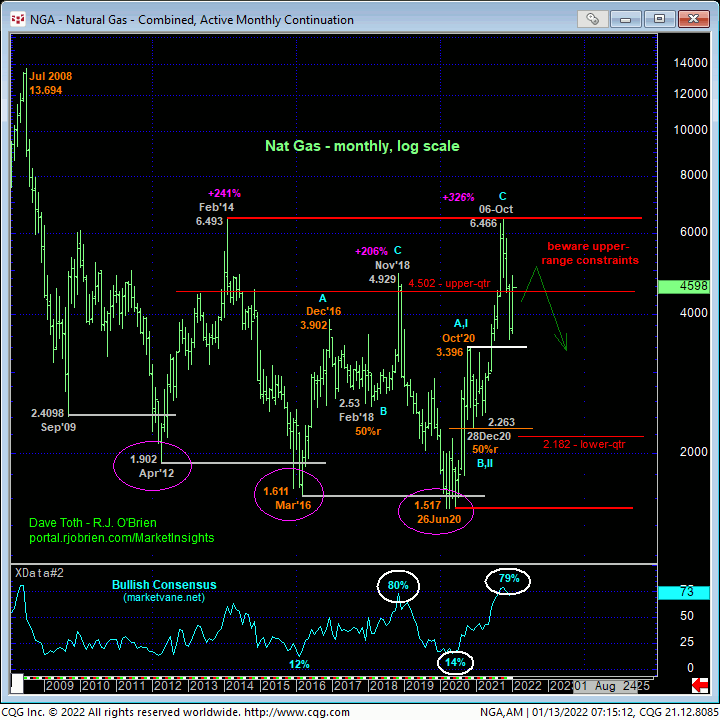
Finally and on an even longer-term basis, the monthly log chart below shows the market’s return to the upper-quarter of a 6.49-to-1.51-range that has encompassed this market for the past 13 YEARS. Since Sep’09” 2.41 low that spans 148 months, this market has spent only 27 months, or 18% of its time above the 4.50 upper-quarter of this range. To maintain any risk/reward merits of a BULLISH policy “up here”, it is clear that this market needs to sustain trendy, impulsive behavior to the upside. Its failure to do so in the weeks ahead given the broader peak/reversal elements discussed above, not the least of which are still-historically-frothy bullish sentiment levels, will contribute to and reinforce this major peak/reversal count and provide what we believe will be a tremendous, long-term risk/reward opportunity from the bear side.
These issues considered, all previously recommended bearish policy and exposure have been nullified for the time being with further lateral-to-higher prices expected in the period immediately ahead. We suspect this period could span a couple/three weeks to a month or so. “Chasing” bullish exposure “up here” after this week’s extended recovery presents poor risk/reward metrics, so a neutral/sideline policy is advised for the time being and until or unless we can identify a tighter bull risk parameter.


