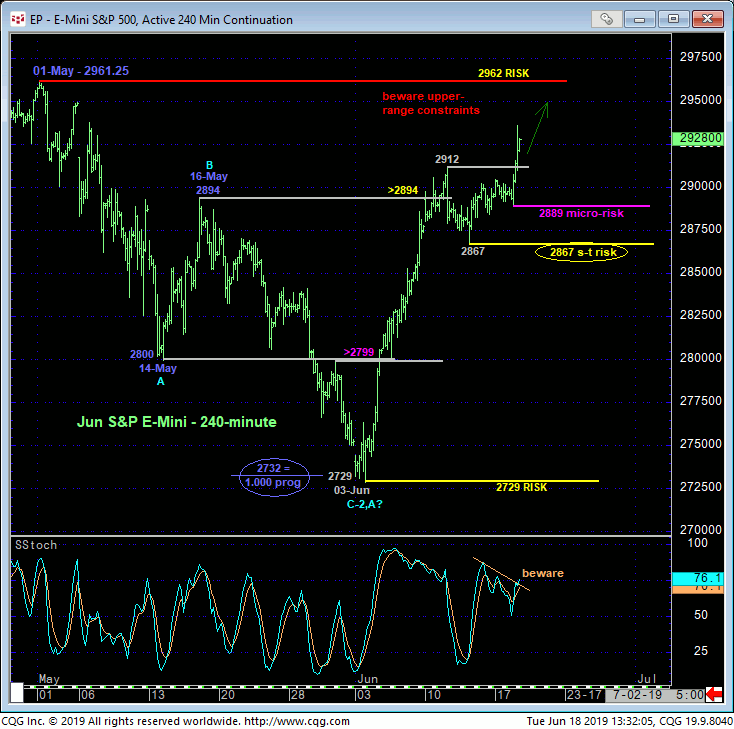
Today’s clear, impulsive break above the past week’s 2905/12-area resistance reaffirms this month’s impressive recovery and leaves smaller-degree corrective lows in its wake at 2889 and 2867 that the market now needs to sustain gains above to maintain a more immediate bullish count. Its failure to do so will confirm a bearish divergence in short-term momentum, stem the rally and expose at least another interim corrective relapse. In this regard these levels can serve as tight but objective risk parameters to a cautious bullish policy and exposure.


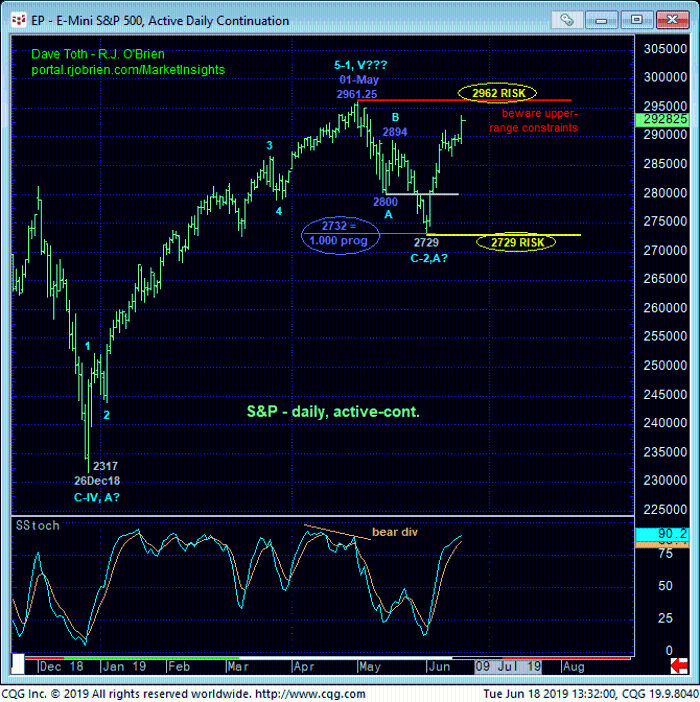
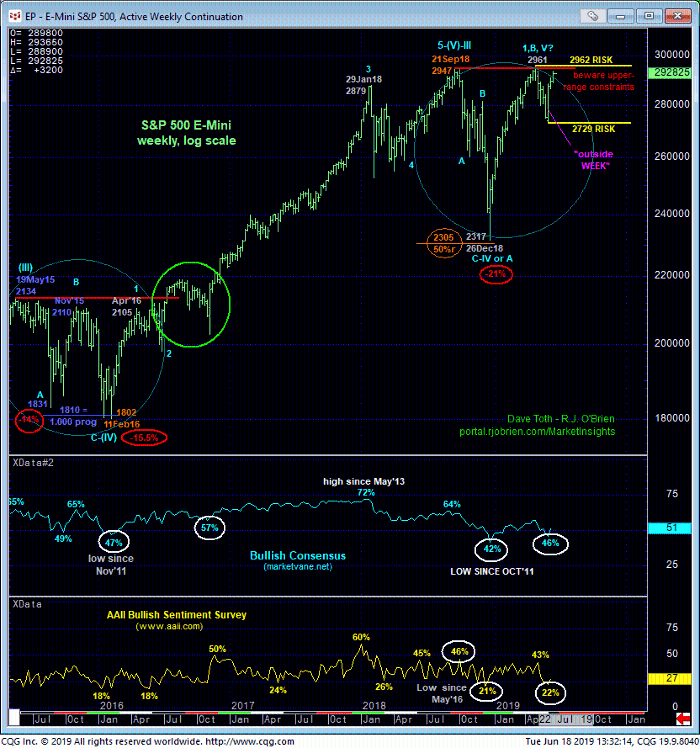
These tight but objective risk parameters may come in handy given the market’s proximity to the 2947-to-2961-range that has capped this market as resistance for the past nine months. If there’s a time and place to be leery of another intra-range relapse, it is here and now.
This said and as discussed in 10-Jun’s Technical Blog, this market is far from devoid of any bullish factors that could aid in the breakout above this obvious resistance candidate. Indeed, the combination of:
- May’s textbook 3-wave and thus corrective sell-off attempt reinforced by
- an exact 1.000 progression of the initial 2961 – 2800 (A-Wave) break from 16-May’s 2894 (B-Wave) corrective high amidst
- the return to historically bearish sentiment/contrary opinion levels
is a recipe for a resumption of Dec-May’s major uptrend that preceded the May relapse. It’s almost too perfect; too textbook. Especially with the Treasury market continuing its relentless uptrend. But if this S&P rally is a falsie, then somewhere along the line it’s gotta fail, stemming this clear and present uptrend. And we can gauge that failure by a relapse initially below 2889 and then certainly below 2867. Until and unless such weakness is shown, there’s no way to know this bull won’t continue to climb the proverbial wall of worry to new all-time highs above 2961. And once above that 2961 threshold, the market’s upside potential is back to indeterminable and potentially severe.
These issues considered, traders are advised to return to a cautious bullish policy and exposure from 2925 OB with a failure below 2889 required to defer or threaten this call enough to warrant a quick exit. In lieu of such sub-2889 weakness, further and possibly accelerated gains should not surprise.


