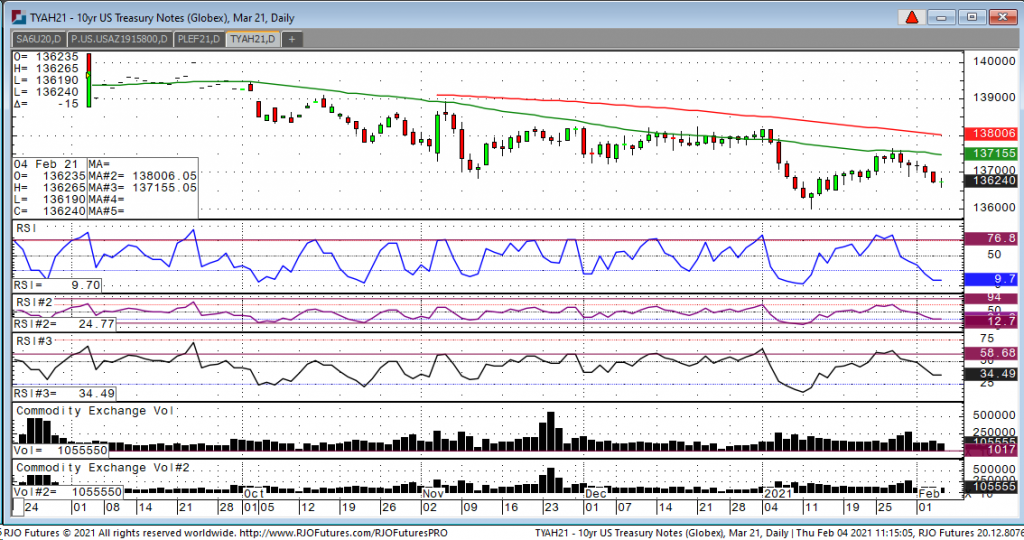
Looking at the march 10-year we had a high overnight of 136-26.5 and a low of 136-19 and currently trading at 136-255. The over trend is now firmly lower with the market currently below the 50-day moving average which currently sits at 137-155. In addition, if you look at the daily chart, today is the fourth day in a row where we see lower highs which also confirms the downtrend. The market is looking ahead of the new stimulus bill that hopes to be passed in the not to distant future. Another bearish factor that the market is absorbing is the decline in unemployment claims. Additionally, as more people are getting vaccinated for the virus, the daily infection fate has dropped to the lowest levels since November. With all the bearishness that we see, traders should be aware that we see speculators and funds are short this market so a bit of a short squeeze could occur especially tomorrow as we have the monthly employment number that comes out at 7:30 central. The street is looking for a gain of 50K vs last month’s decline of 140K. Looking at support and resistance levels, I see 136-10 on the downside and 137-155-137-20 on the upside.