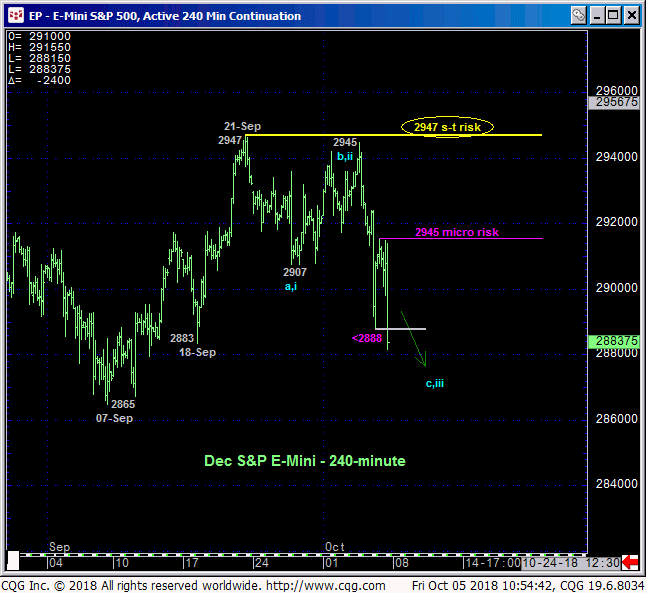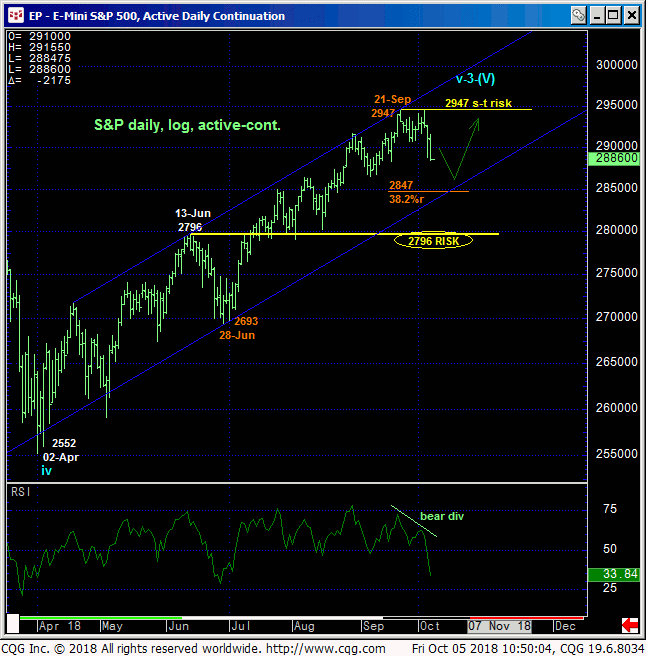
Yesterday’s clear break below last week’s 2907 low confirms at least the short-term trend as down and leaves Wed’s 2945 high in its wake as a (b- or 2nd-Wave) corrective retest of 21-Sep’s 2947 all-time high. Today’s subsequent weakness below yesterday’s 2888 low reinforces interim weakness and an intermediate-term correction that, given the scope and uninterrupted nature of Jun-Sep’s portion of the bull, could be relatively extensive. Per such shorter-term traders are advised to neutralize bullish exposure to circumvent the depths unknown of a suspected correction of the rally from 28-Jun’s 2693 low.
The important by-products of this weakness is the definition of 21-Sep’s 2947 high as one of developing importance and a minor corrective high at 2945 that the market would now be expected to sustain losses below to maintain a more immediate bearish count. Per such these levels represent our new short- and micro-term risk parameters from which non-bullish decisions like long-covers and cautious bearish punts can now be objectively based and managed.


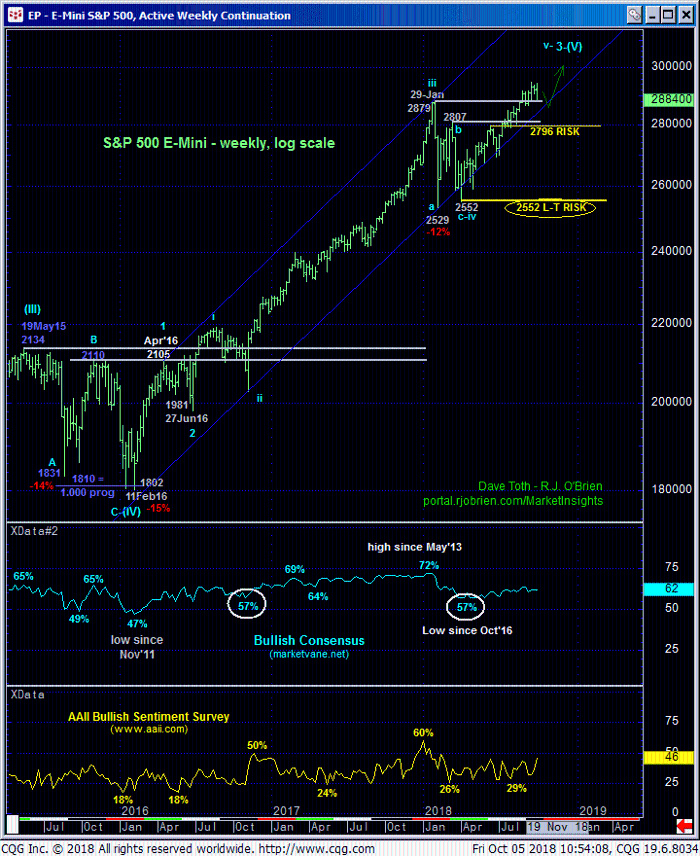
From a longer-term perspective, today’s bearish divergence in momentum and relapse thus far is of an insufficient scale to be approached as anything more than an interim correction within the secular bull trend. Only a glance at the weekly log chart below is needed to see that the market remains above a ton of former resistance-turned-support, let alone prior corrective lows the market needs to break to threaten the long-term uptrend. Indeed, the market has yet to retrace even a Fibonacci minimum 38.2% of the rally from even 28-Jun’s 2693 corrective low.
This is not to say the market may not be on the cusp of a more protracted correction or reversal lower, but rather that it would be grossly premature to CONCLUDE such a call following such relatively minor weakness thus far.
These issues considered, shorter-term traders with tighter risk profiles are advised to move to a neutral/sideline position to circumvent the depths unknown of a suspected correction lower. A recovery above 2945 will stem this relapse and reject/define a more reliable low from which a resumed bullish policy can be objectively rebased and managed. We will keep a keen eye on a countering bullish divergence in short-term momentum in the days/week ahead. Long-term players remain advised to maintain a bullish policy with commensurately larger-degree weakness below 2796 still required to threaten the major uptrend and warrant neutralizing bullish exposure.


