Posted on Feb 08, 2023, 08:33 by Dave Toth
Against the backdrop of rising interest rates over the past three weeks and after Fri’s monster jump in nonfarm payrolls, the S&P’s resilience is impressive and consistent with our interim bear market correction count discussed in 23-Jan’s Technical Blog. The 240-min chart below details the past week’s setback attempt that has thus far held around former 4109-to-4091-area resistance-turned-support, leaving yesterday’s 4098 low as a very, very tight corrective low this market is now required to confirm a bearish divergence in very short-term momentum and break the uptrend from at least 31-Jan’s 4007 low. Per such, we’re identifying 4098 as our very tightest bull risk parameter pertinent to short-term traders.
This 240-min chart also shows 31-Jan’s 4007 low as the next larger-degree corrective low that we believe this market is minimally required to fail below to threaten the broader rebound from 22-Dec’s 3788 low and possibly mark the end of a broader bear market correction that dates from last Oct’s 3502 low. Per such, we’re defining 4007 as our new short-term but key bull risk parameter, the failure below which would warrant greater scrutiny by intermediate-to-longer-term players as a threat to a continued bullish policy and exposure.


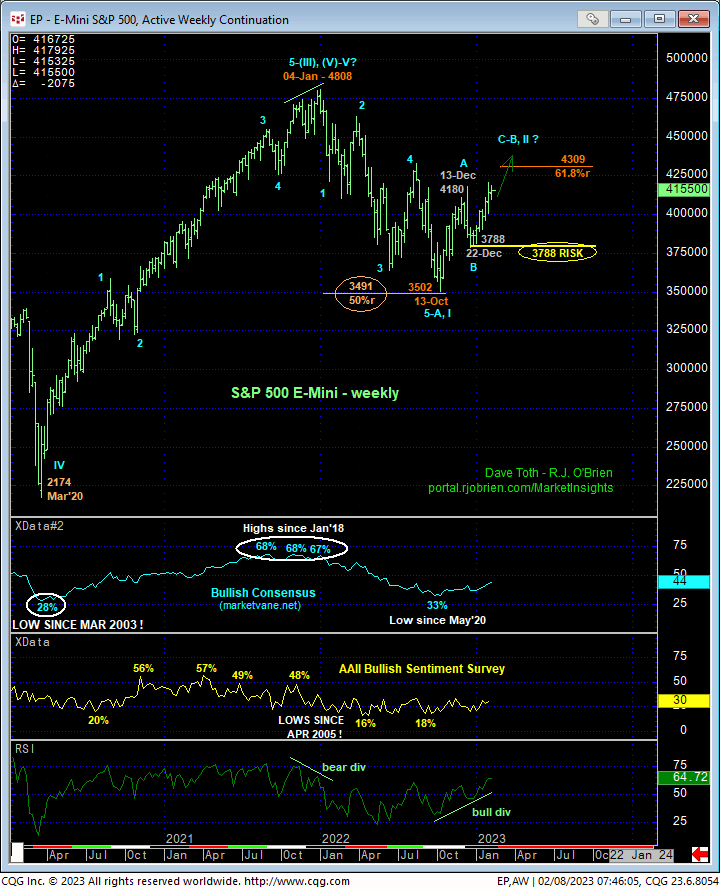
On a broader scale, the daily (above and weekly (below) charts show the clearly developing recovery that, after breaking mid-Dec’s initial counter-trend high last week, reinstates the broader recovery from 13Oct22’s 3502 low. As discussed in 23-Jan’s Technical Blog and given long-term peak/reversal elements that date from 1Q22, we believe the recovery from 22-Dec’s 3788 low is the completing C-Wave of a major bear market correction. Until/unless this market fails below at least 4007 however, and especially 3788, further and possibly accelerated gains remain anticipated.
For subjective and derived Elliott and Fibonacci relationship reasons, we believe this rally has the potential to reach the 4300-to-4400-area into mid-to-late-Mar, but this target or forecast should be taken with a grain of salt (as all so-called targets or forecasts should). What matters most however is MOMENTUM, and the market’s ability to sustain trendy, impulsive behavior higher. If/when it fails to do so by failing below corrective lows like 4007 and especially 3788, we’ll address the market’s subsequent downside implications. These bull risk parameters, especially the smaller-degree corrective lows, will be adjusted or “trailed” higher as the recovery proceeds.

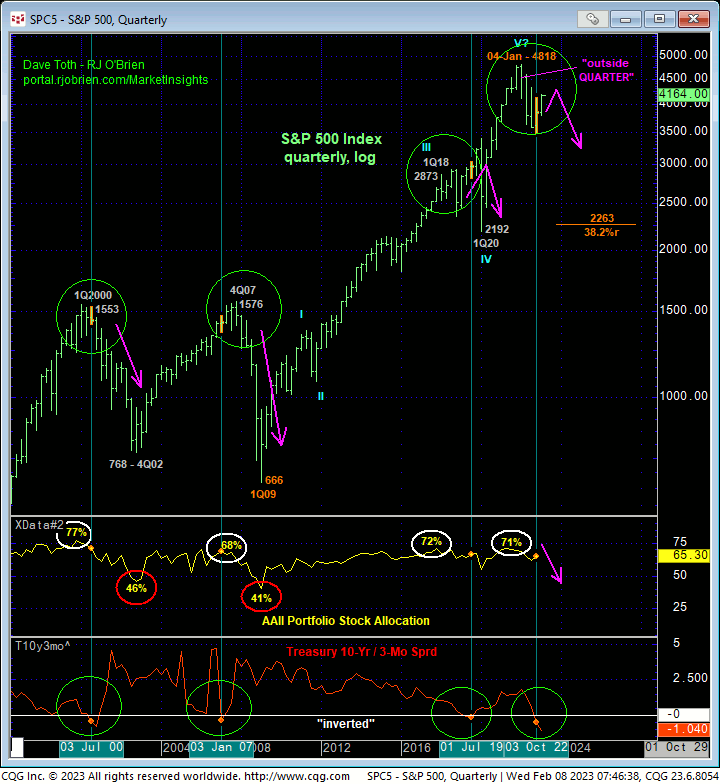
Finally and from an even longer-term quarterly log scale basis, the chart below shows the elements that still warn of a peak/reversal-threat process that could be major in scope:
- Jan’22’s bearish divergence in MONTHLY momentum that broke the uptrend from at least Mar’20’s 2192 low
- historically extreme bullish sentiment/contrary opinion levels
- “outside week, month and quarter down” the week, month and quarter of 04Jan22’s 4808 high
- an inverted Treasury yield curve, especially the indicting 10-yr-to-3-mo spread that has an excellent record of warning of major reversals or corrections, and
- an arguably complete and massive 5-wave Elliott sequence that dates from 2009’s 666 low.
This is an extraordinary and compelling confluence of technical facts and observations that, if correct, warns of a reversal lower that can be monstrous.
This takes us back to qualifying Jan-Oct’22’s decline from 4808 to 3502 and the current recovery from 3502 that can only be one of two things:
- Jan-Oct’22’s 4808-to-3502 decline is a complete correction, and the secular bull is poised to resume to new all-time highs straight away, or
- Jan-Oct’22’s 48808-to-3502 decline is just the initial (A- or 1st-Wave) of a massive correction or reversal lower and the current rebound is a (B- or 2nd-Wave) correction within the major peak/reversal process.
In the former bullish count, the market would be expected to BEHAVE LIKE A BULL by sustaining trendy, impulsive behavior above levels like 4007 and especially 3788 and eventually take out last year’s 4808 high. If, alternatively, this recovery continues for another month or so to, say, the 4300-handle-area and rolls over from a bearish divergence in momentum, that will be the first indication of the latter and very bearish count, with ultimately a break below 22-Dec’s key 3788 larger-degree corrective low the coup de grace. If/when this market fails below 3788, we believe the subsequent resumption of the major multi-quarter reversal below last Oct’s 3502 will be disastrously opportunistic.
So the roadmap has been defined. A prospectively interim bullish policy and exposure remain advised, with failures below 4098, 4007 and especially 3788 the levels where traders are advised to take defensive measures commensurate with their personal risk profiles and trading/investment objectives. In lieu of such weakness, further and possibly accelerated gains remain expected.


