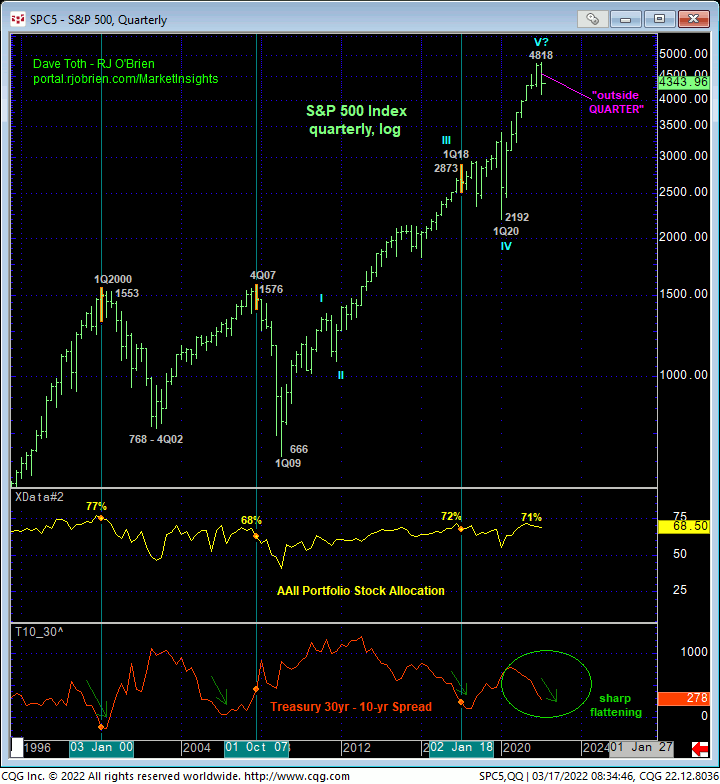
This week’s not unimpressive recovery above last Fri’s 4327 high confirms a bullish divergence in short-term momentum. Stemming from the lower recesses of the lateral range that has been developing over the past three weeks, this momentum failure confirms Tue’s 4129 low clearly as one of developing importance and our new short-term risk parameter from which non-bearish decisions like short-covers and cautious bullish punts can be objectively based and managed. A failure below 4129 will mitigate an interim bullish count and resurrect a broader bearish sense of urgency.
On an even shorter-term basis, yesterday’s component of this week’s rebound leaves yesterday’s 4242 low in its wake as the latest smaller-degree corrective low the market’s now got to sustain gains above to maintain a more immediate bullish count. For shorter-term traders trying to play it very close to the vest, this 4242 level serves as our new mini risk parameter from which to do so. This said, the 240-min chart below also shows 03-Mar’s 4419 upper boundary to the 3-week range and 61.8% retrace of Feb’s preceding decline from 4585 to 4101 as the next pertinent threshold this market needs to recoup to reinforce at least an intermediate-term bullish construct. For as we’ll discuss below from a longer-term perspective, this market remains far from being out of the proverbial woods with respect to a major peak/reversal process.
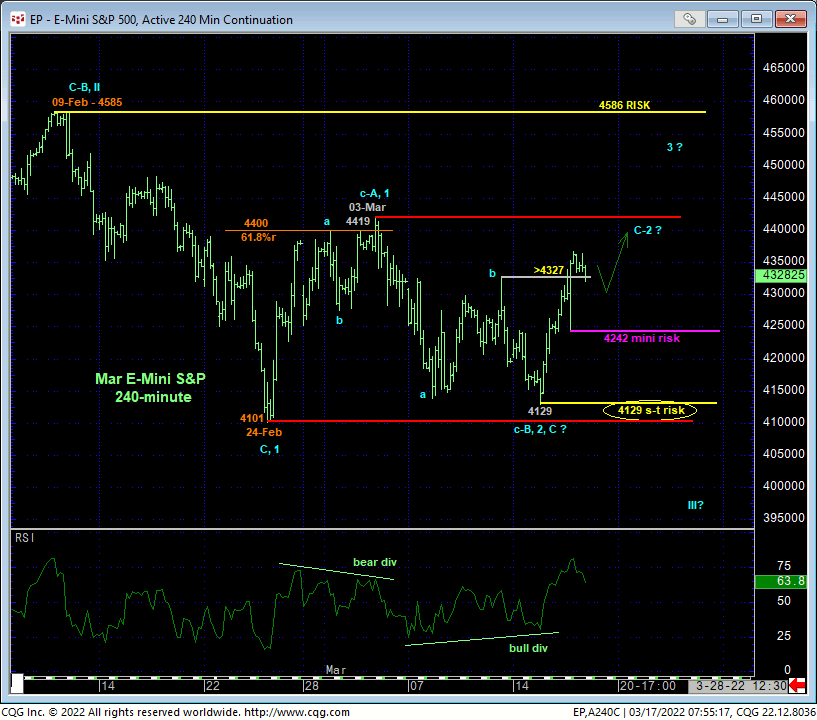
Stepping back, the daily log chart below shows the major peak reversal threat from 04-Jan’s 4808 all-time high to what we believe is the orthodox bottom to this decline thus far at Tue’s 4129 low (we’re casting off 24-Feb’s 4101 low as a “rogue low” with less technical pertinence that this week’s 4129 low). TO THIS POINT, the entire Jan-Mar decline looks to be only a 3-wave affair, that, according to Elliott “theory” (for what that’s worth) and left unaltered by continued weakness below 4129, may be considered a corrective/consolidative structure that could re-expose the secular bull market.
To reinforce this 3-wave count however, this market is still obligated to recover above 09-Feb’s 4585 larger-degree corrective high and key long-term bear risk parameter. And even then, the market would remain a goodly distance away from Jan’s 4808 all-time high and THE level this market is ultimately required to break to negate any broader bearish count and reinstate the secular bull.
The key takeaway from this analysis thus far is that while commensurately larger-degree strength above 4585 remains minimally required to raise the odds of a longer-term bullish outcome, we believe the market has identified Tue’s 4129 low as an important low, support and risk parameter from which bulls can objectively base non-bearish decisions like short-covers and bullish punts. In effect and from a long-term perspective, we believe the market has defined 4129 and 4586 as the key directional flexion points heading forward. The interim decision-making challenge to this count is the market’s current position pretty much in the middle of these two point where the risk/reward metrics of initiating directional exposure are poor. This dilemma highlights the always-important matter of technical and trading SCALE and one’s adherence to risk assumption commensurate with one’s personal risk profile.
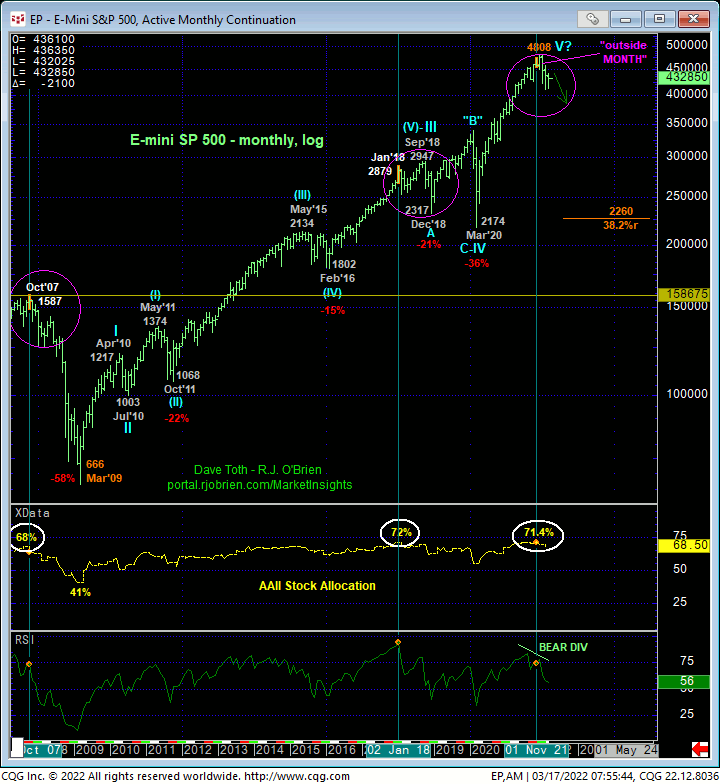
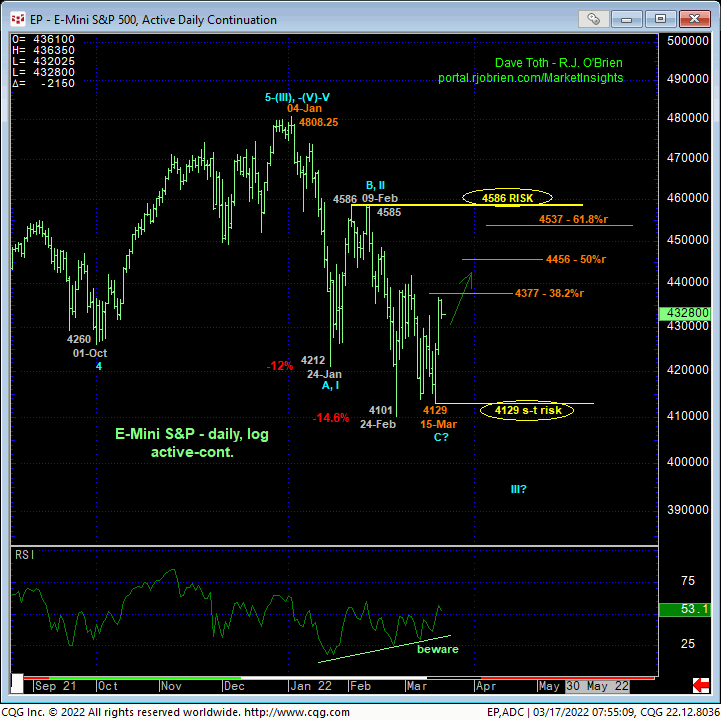
From an even longer-term perspective, the major peak/reversal elements stemming from the extent of Jan-Mar’s decline remain intact:
- a confirmed bearish divergence in MONTHLY momentum that breaks the major uptrend from at least Mar’20’s 2174 low
- historically frothy sentiment/contrary opinion levels
- an “outside MONTH down” the month of the high (higher high, lower low and lower close than Dec’s range and close)
- a prospective “outside QUARTER down” unless the market explodes higher over the next two weeks (higher high, lower low and lower close than 4Q21’s range and close)
- an arguably complete 5-wave Elliott sequence up from Mar’20’s 2174 low that could be the
- completing 5th-Wave of an even more massive 5-wave sequence up from Mar 2009’s low, and,
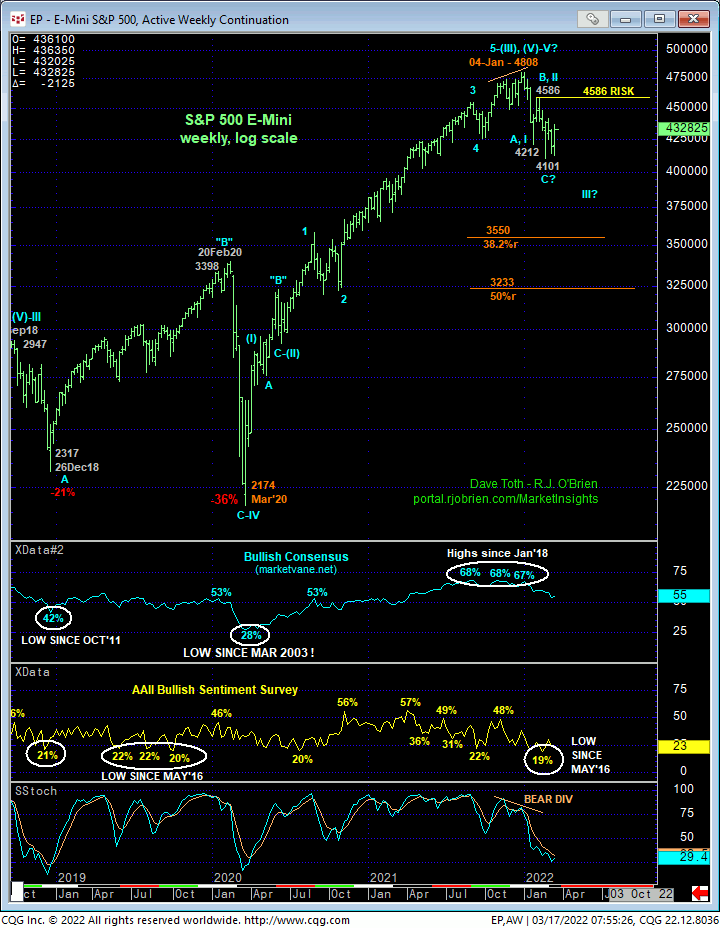
- a sharply flattening yield curve.
In our T-Note Technical Blogs, we have discussed what we believe is a base/reversal process in Treasury yields from Aug’20’s 0.502% low in the 10-Yr that could be generational in scope, reversing a 39-YEAR decline in yields that began in 1981. Against this backdrop of generally rising interest rates, a contributing factor to a peak/reversal threat to equities is a flattening yield curve as shown in the quarterly log chart of the underlying S&P 500 Index below. A flattening curve results from shorter-term rates rising faster than longer-term rates. In the current case, this is happening as a result of the shorter-end of the yield curve’s acknowledgement of and reaction to global inflationary elements that ultimately portends slower economic performance down the road that will ultimately negative impact equities.
Indeed, the previous three times the 30-yr/10-yr yield spread flattened as it is now all led to major corrections or reversal in the S&P: 2018, 2007 and 2000. This another foreboding contributory element to what is already an ominous list of technical facts and observations that have warned of and accompanied major peak/correction/reversal environments since 2000. These long-term factors do not preclude a larger-degree correction of Jan-Mar’s 4808 – 4129 decline. But if our major peak/reversal count is wrong and if the risk/reward merits of a resumed longer-term bullish are to remain preferred, it is absolute imperative that this market sustain trendy, impulsive behavior to the upside, initially rallying above 09-Feb’s 4585 high AND THEN SUSTAINING trendy, impulsive behavior up thereafter. Any other price action than this, and especially a relapse below 4129, will remain within the construct of a peak/reversal environment that could be major in scope and span quarters or even years.
These issues considered, shorter-term traders are advised to move to a neutral-to-cautiously-bullish stance with a failure below 4242 negating this specific call and warranting its cover. A bearish policy and exposure remain advised for longer-term institutional players and investors with a recovery above 4586 still required to threaten this call enough to warrant its cover. While the market remains between these two key flexion points, the odds of aimless whipsaw risk and choppy, lateral price action remain a concern for the time being.
