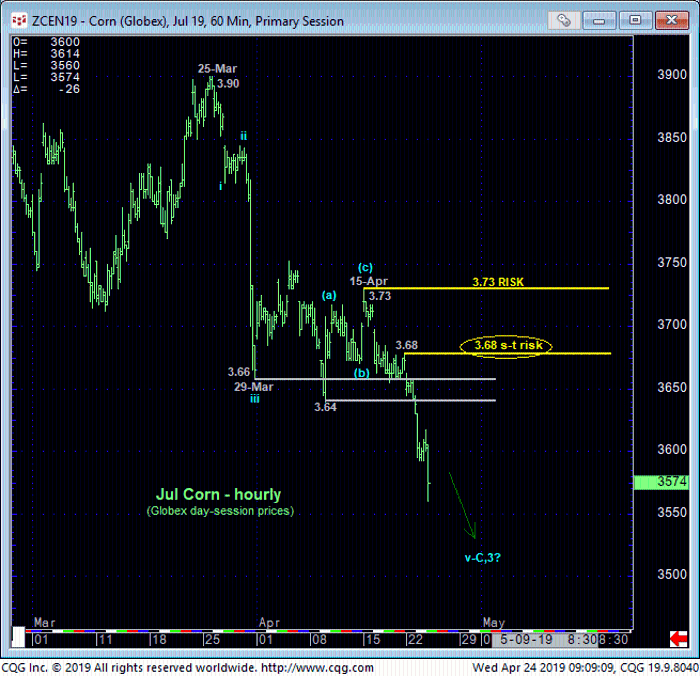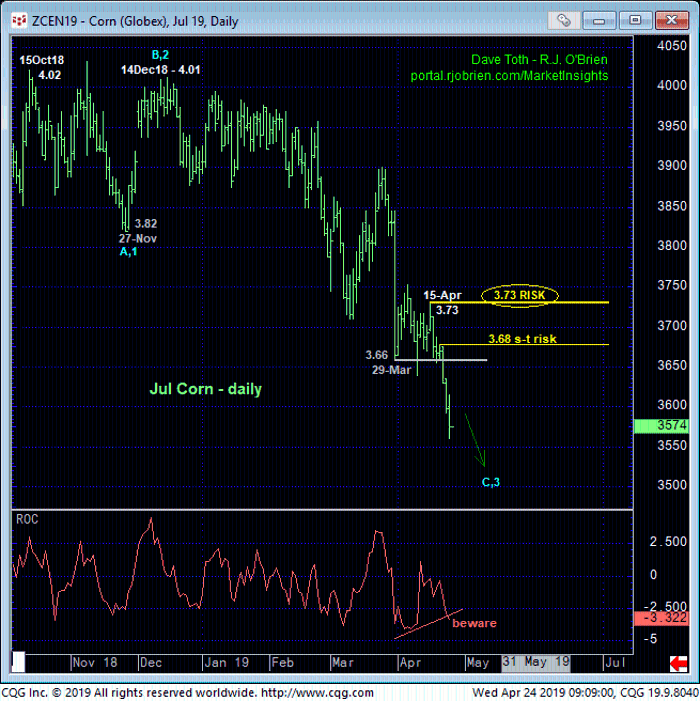

Now this is the way a bear market is supposed to behave. Beat-downs, almost relentlessly, with the market easily sustaining trendy, impulsive behavior below prior support and certainly below prior corrective highs. Mon afternoon’s break below early-Apr support from the 3.66-to-3.64-area and subsequent accelerated losses leave 18-Apr’s 3.68 high in its wake as the latest smaller-degree corrective the market is now minimally required to recoup to jeopardize the impulsive integrity of a more immediate bearish count. This level is also just above that former 3.64-to-3.66-area support-turned-resistance, reinforcing it as a tight but objective short-term risk parameter from which a still-advised bearish policy and exposure can be objectively rebased and managed by shorter-term traders with tighter risk profiles.
Commensurately larger-degree strength above 15-Ar’s 3.73 next larger-degree corrective high is now minimally required to threaten the major downtrend from 14Dec18’s 4.01 high. This level serves as our new long-term risk parameter.


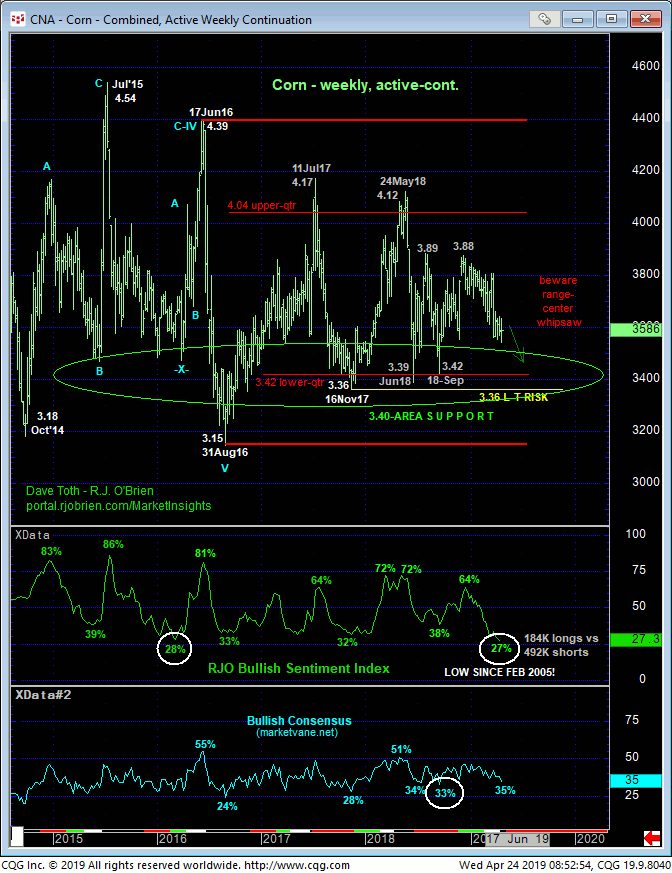
As awful as this market looks currently however, the weekly active-continuation chart above shows the market still well within the middle-half bowels of its incessant 4-1/2-YEAR lateral range and still 15-to-20-cents away from what has been HUGE support between 3.35 and 3.45 the past two years. So while the bear trend has been developing well over the past couple months, it’s got its work cut out for it as it engages the 3.45-to-3.35-area that has repelled all previous sell-off attempts the past 18 months. Herein lies the importance of identifying recent corrective highs and risk parameters like 3.68 and 3.73 that the bear is required to sustain losses below IF it has any chance at resuming the secular bear market to new lows below not only Nov’17’s 3.36 low, but Aug’16’s 3.15 low.
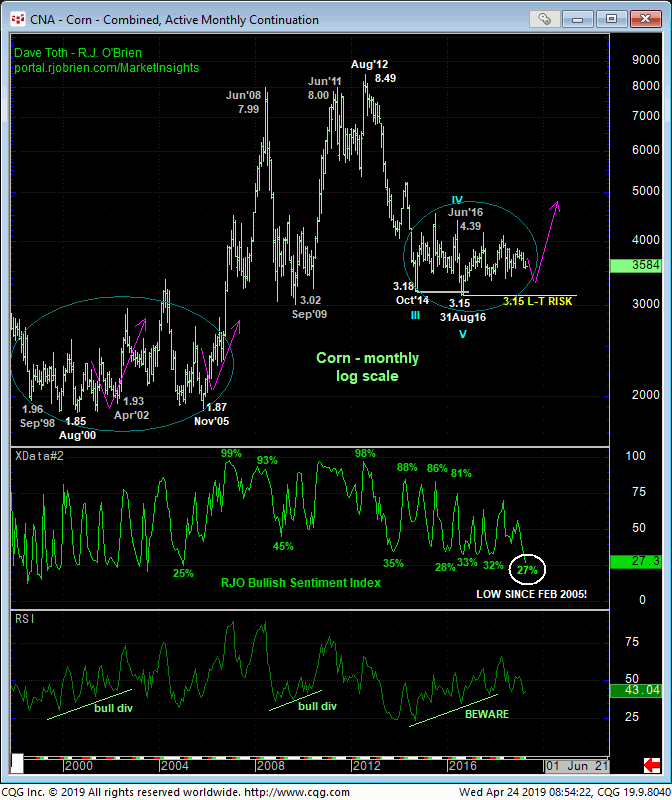
Taking an even bigger step back, the monthly log active-continuation chart below shows that this market- even with the current relentless drubbing- still has not come close to providing the evidence to negate the prospects for a major, multi-year BASE/reversal environment similar to that that unfolded from Sep 1998 until arguably Sep 2006. Long-term players may want to revisit that 8-year period to see if macro-economic conditions were as bad as current conditions are. There were certainly plenty of big, scary, emotional relapses and retests of the extreme lower recesses of that 3.00-to-1.87-range driven by many factors, but the secular bear from 1996’s 4.94 high never resumed.
Currently, like then, market sentiment levels are understandably historically depressed. Such widespread bearishness is typical of major BASE/reversal environments. But traders are again warned that sentiment/contrary opinion is not an applicable technical tool in the absence of a confirmed bullish divergence in momentum of a scale sufficient to break the major downtrend. Herein lies the importance of 15-Apr’s 3.73 corrective high. We don’t know where this market is going to the downside; to just 3.45 or to 2.95. But per any such broader bearish count, this market should not come anywhere near 15-Apr’s 3.73 corrective high, let alone recover above it.
In sum, we believe this 3.73level is this market’s single most important technical level and condition. A bearish policy remains advised with recovery attempts first approached as corrective selling/hedging opportunities with former 3.65-area support considered new near-term resistance (although we don’t believe this market should come anywhere near that 3.65-area either). Further and possibly accelerated losses remain expected with the 3.45-to-3.35-range the next key downside threshold. Given the prospects of either a sub-3.30 meltdown or another major buying opportunity from the 3.40-area given historically bearish sentiment conditions, we will obviously be watching MOMENTUM and any developing potential for a bullish divergence in the weeks ahead. In lieu of such a mo failure however, further losses remain expected.


