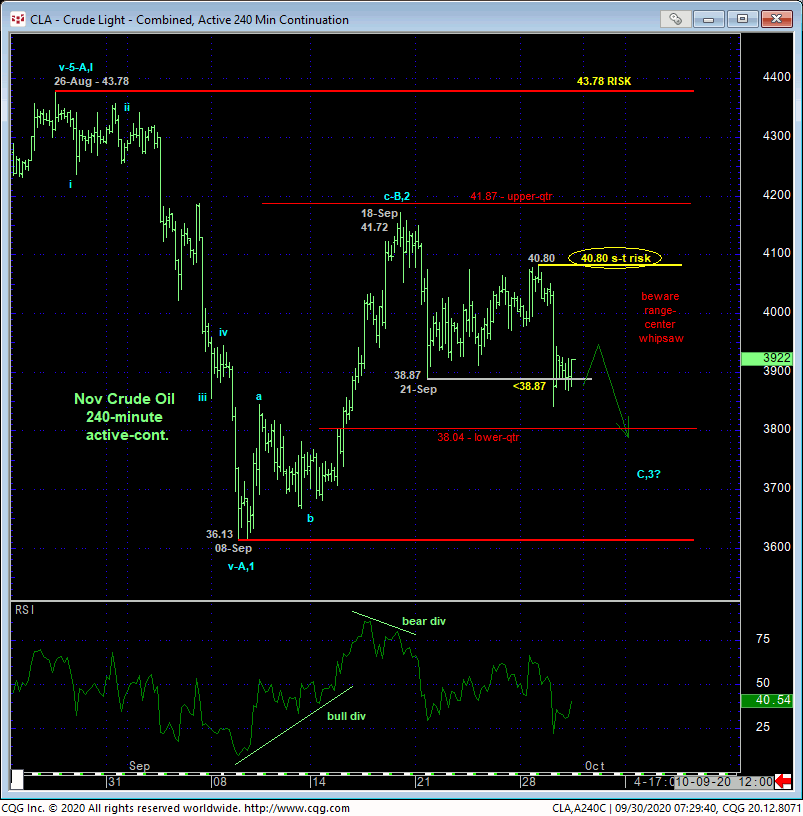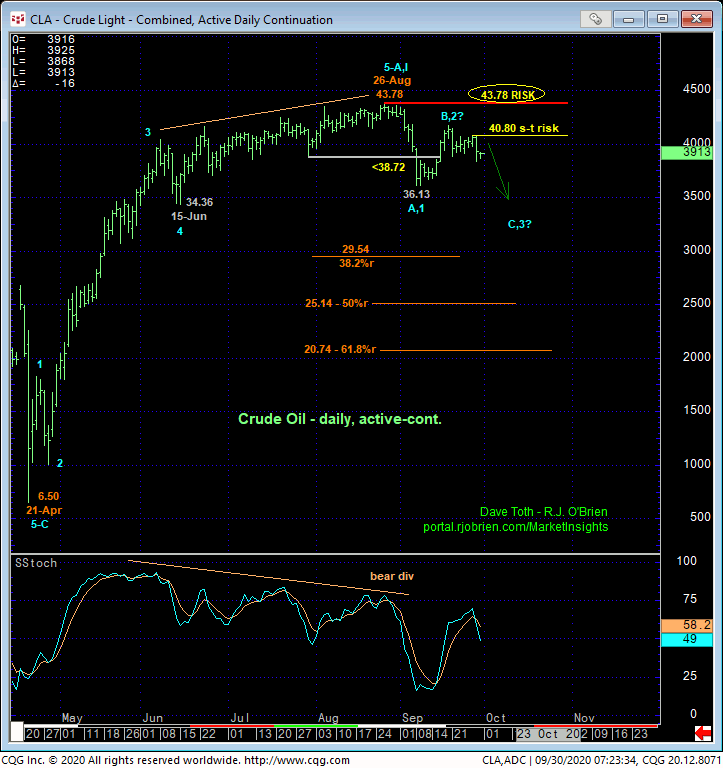
Yesterday’s break below 21-Sep’s 38.87 low reinforces our peak/correction/reversal count introduced in 02-Sep’s Technical Webcast and updated in 21-Sep’s Technical Webcast. This intra-range weakness leaves Mon’s 40.80 high in its wake as the latest smaller-degree corrective high the market would be expected to sustain losses below in order to maintain a more immediate bearish count. In this regard this 40.80 level becomes our new short-term risk parameter from which traders can rebase and manage the risk of a cautious bullish policy and exposure.
The other noticeable technical fact to be gleaned from the 240-min chart below is that the market remains deep within the middle-half bowels of the past month’s range where we always approach the odds of aimless whipsaw risk as higher, warranting a more conservative approach to risk assumption. And such an approach highlights the importance of tighter but objective risk parameters like 40.80.
Such lateral, choppy, frustrating consolidation environments are a fact of trading life and occur roughly 2/3rds of the time in all markets on all scales. We believe this is exactly why even the best traders in the world are right on only 1/3rd of the directional decisions, which are typically in trendy conditions when and where the “trend is your friend”. If there’s such a thing as easy or easier money in trading, it most certainly is during trendy conditions. Under lateral, choppy conditions the crude oil market finds itself currently, the odds of successful, profitable directional bets are lower. Understanding and acknowledging this makes it easier to accept losing trades and underscores the importance of identifying tighter but objective risk parameters IF the trader decides to participate at all under such more challenging consolidative circumstances.


With the past month’s lateral chop in mind, traders are reminded of the longer-term technical facts on which our broader peak/correction/reversal count is predicated:
- 08-Sep’s confirmed bearish divergence in momentum below 30-Jul’s 38.72 larger-degree corrective low that, in fact, broke Apr-Aug’s uptrend
- a complete/textbook 5-wave Elliott sequence from 21-Apr’s 6.50 low to 26-Aug’s 43.78 high as labeled in the daily chart above
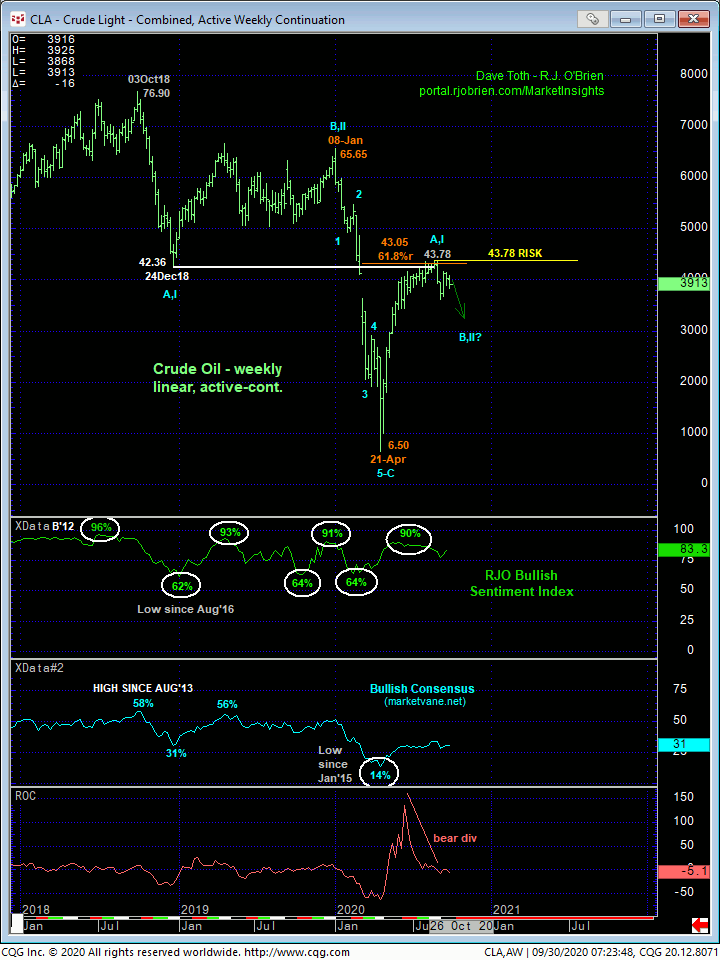
- Jun/Jul/Aug’s return to historically frothy levels in our RJO Bullish Sentiment Index of the hot Managed Money positions reportable to the CFTC
- the market’s rejection of the (43.05) 61.8% retrace of Jan-Apr’s 65.65 – 6.50 meltdown shown in the weekly linear chart below and
- the market’s rejection of key former 42-handle-area support from Dec’18 that, since demolished by Mar/Apr’s collapse, became a key new resistance candidate.
Thus far and while admittedly of a choppy, lateral nature, the past month’s price action has reaffirmed this peak/correction/reversal count. What is always a challenge in navigating a correction is understanding and acknowledging the total unknown with respect its scope in terms of price and time. Corrections can be deep, quick, nasty beasts that retrace more than 61.8% violently. Or they can be shallower but more time consuming with intra-range whipsaw that can cause the pulling out of every last hair.
Understanding these relative rules and guidelines as a backdrop for a directional game plan, we start from a longer-term perspective that, for the reasons listed above, is bearish until and unless this market recoups 26-Aug’s 43.78 high and key long-term risk parameter. Then, trying to hone in on tighter risk parameters, we consider an intra-range break below a level like 38.87 as proof of at least short-term weakness that- who knows?- could morph into that bigger C- or 3rd-Wave down per the longer-term bearish count. In this specific case, a recovery above 40.80 is required to negate the short-term bearish count and warrant its cover, but it is insufficient to negate the longer-term bearish count.
These issues considered, a cautious bearish policy and exposure remain advised for short- and long-term traders with a recovery above 40.80 required to negate the short-term count and warrant its cover and commensurately larger-degree strength above 43.78 to negate our broader peak/correction/reversal count and reinstate the bull, which would obviously require a reversal to a bullish policy for long-term players. Until and unless such strength is proven, further lateral-to-lower prices should not surprise.


