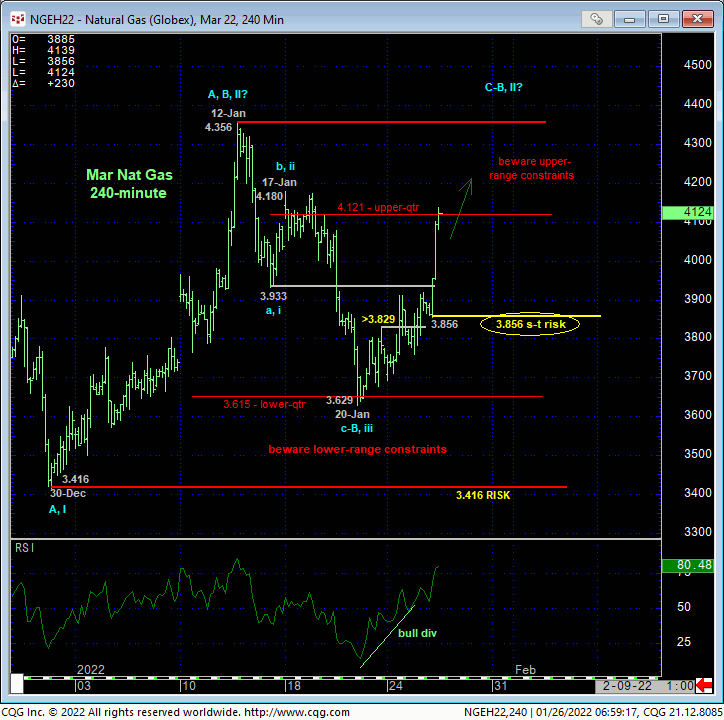
Since 10-Jan’s bullish divergence in daily momentum broke Oct-Dec’s downtrend and then subsequently as discussed in 13-Jan’s Technical Blog, we’ve been navigating the difficult, volatile and challenging corrective environment up from 30-Dec’s 3.416 low. Last week’s failure below 14-Jan’s 3.933 low reaffirmed the intermediate-term downtrend. However, Mon’s bullish divergence in momentum, especially from the lower-quarter of the past month’s range, stemmed that intermediate-term intra-range sell-off attempt and exposed another intra-range rebound that has been reinforced by overnight’s clear spike above 14-Jan’s former 3.933-area support-turned-resistance. Clearly, on at least an intermediate-term basis, the trend is now up, leaving today’s 3.856 low in its wake as the latest smaller-degree corrective low the market is now required to sustain gains above to maintain a more immediate, if intra-corrective-range uptrend. Per such, this 3.856 level becomes our new short-term but important risk parameter from which a neutral-to-cautiously-bullish tack can be objectively based and managed.
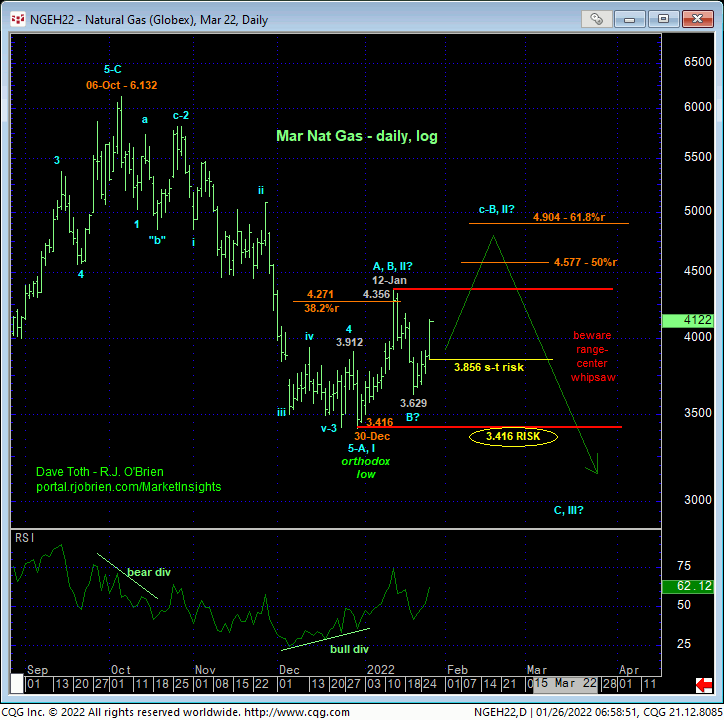
Corrections can be nasty, aimless, frustrating beast and, indeed, are the non-trending environments where even the best traders in the world LOSE MONEY. Per such, a more conservative approach to risk assumption is always urged under these conditions, and herein lies the importance of overnight’s admittedly tight but objective bull risk parameter at 3.856. Until and unless sub-3.856 weakness negates the impulsive integrity of the current recovery, there’s no way to know if 12-Jan’s 4.356 high and upper boundary to the recent range will contain the current pop OR if the rally from last week’s 3.629 low is the completing C-Wave of a major correction from 30-Defc’s 3.416 low that could bust-out above 4.356 to levels indeterminately higher as labeled in the daily log chart below.
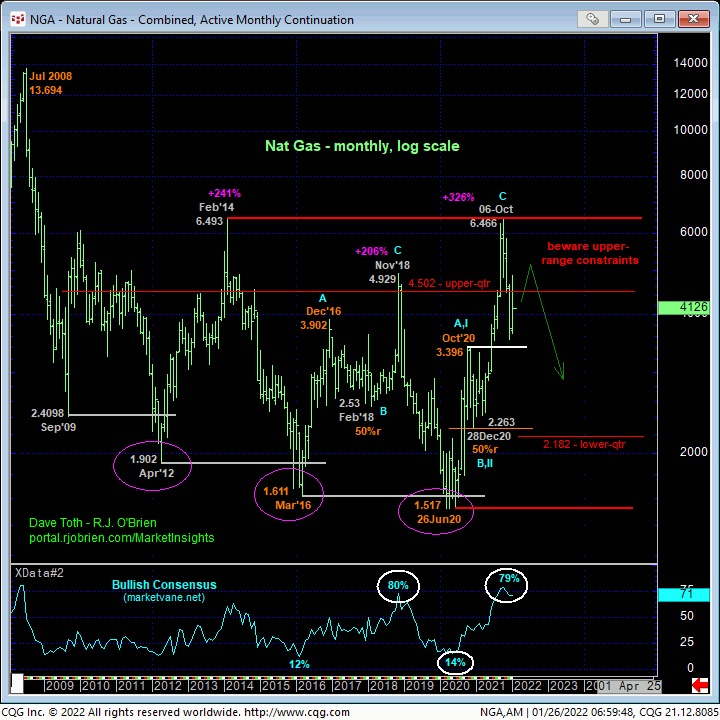
In recent updates we’ve discussed more extensive (B- or 2nd-wave) corrective rebuttals to initial (A- or 1st-wave) counter-trend declines not uncommon within broader peak/reversal PROCESSES. The weekly log chart below shows Aug-Sep’20’s extensive relapse within 3Q and 4Q20’s major base/reversal process that ultimately led to a massive 326% reversal higher. Currently, further and steeper gains as a correction to Oct-Dec’s 6.466 – 3.536 decline within a major peak/reversal process would/should hardly come as a surprise. Moreover, such ENDS of corrective recoveries are often times highly-charged, emotional events that entice the huddled masses to chase them, getting over-exposed that sets the stage for another gross momentum failure and resumption of the major peak/reversal process lower.
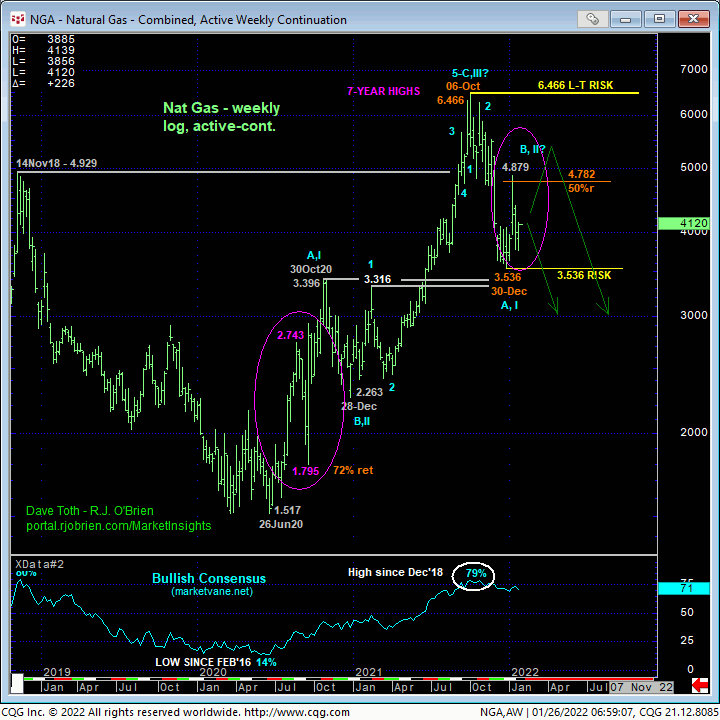
It’s not hard at all currently to speculate on why, fundamentally, this market may be seeing a sharp bid. But from a long-term perspective, the only thing that can negate our major PEAK/reversal count is a recovery above Oct’s 6.466 high. Until and unless such strength is proven, recovery attempts remain advised to first be approached as corrective selling opportunities by longer-term commercial players. This said and until a more immediate bullish count is negated by a failure below 3.856, further and possibly sharp gains to levels above 12-Jan’s 4.356 high should not surprise.
If our long-term peak/reversal count is correct, then somewhere between that 4.356 high and Oct’s 6.466 high on an active-continuation basis the market would be expected to arrest the recovery attempt with a bearish divergence in momentum. That could provide a unique and long-term risk/reward opportunity from the bear side. Until and unless such a mo failure stems any recovery, we will not question or underestimate the market’s upside potential, including negating our massive peak/reversal count (we’ve been wrong before).
These issues considered, a cautious bullish policy is advised, even from current 4.14-area levels, with a failure below 3.856 required to negate this call and warrant its cover. In lieu of such weakness, further and possibly accelerated gains straight away, including a break above 12-Jan’s 4.356 high, should not surprise.