Posted on Dec 07, 2022, 08:08 by Dave Toth
In 30-Nov’s Technical Webcast we warned of the possibility of further lateral consolidation within the past month’s range if the market failed to take out 11-Nov’s 1074.1 high. Following a bearish divergence in short-term momentum last Fri, the 240-min chart below shows the market’s relapse to the lower recesses of the range bounded by that 1074.1 high and 21-Nov’s pivotal 970.7 low. Against the backdrop of the past THREE MONTHS’ impressive and impulsive rally however, this recent relapse is considered the potentially completing c-wave of the correction/consolidation that stems from 11-Nov’s 1074.1 high that still warns of a (suspected 5th-Wave) resumption of Sep-Nov’s uptrend that preceded it.
By virtue of this relapse, the market has obviously identified the 1066.8-to-1074.1-area as key resistance the market has to take out to reaffirm our bullish count and reinstate the uptrend. By the same token however and per our broader bullish count, this market remains required to break below at least 21-Nov’s 970.7 low to expose a larger-degree correction or reversal lower. Per such, this 970.7 level remains intact as a short-term but key bull risk parameter. And now that the market has reverted to the lower recesses of this range, we believe a favorable risk/reward opportunity from the bull side is presented.


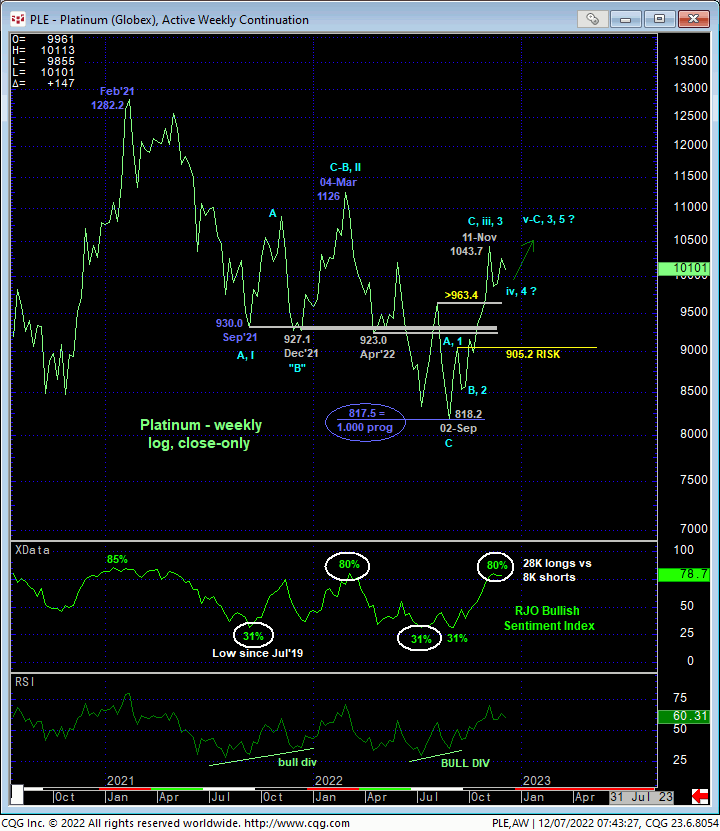
On a broader scale, it’s easy to see the developing and potentially major base/reversal count from 01-Sep’s 796.8 intra-day low and 02-Sep’s 818.2 weekly low close that makes 2022’s entire downtrend from 04-Mar’s 1126 high identical in length (i.e. 1.000 progression) to Feb-Se’21’s initial decline from 1282.2 to 930. The combination of:
- this exact Fibonacci progression relationship
- historically bearish sentiment/contrary opinion levels in Jul-Sep
- a confirmed bullish divergence in weekly momentum, and
- the market’s gross failure to sustain Jun-Sep losses below a TON of former support-turned-resistance around the 920-to-930-area
is a compelling list of technical facts that warn of a base/reversal count that could be monstrous in scope, including a resumption of a new secular bull trend to eventual highs above 2021’s 1348 high. But per such a long-term bullish count, it is important for the market to now BEHAVE LIKE A BULL via sustained, trendy, impulsive behavior higher. A failure below at least 970.7 and especially a suspected 1st-Wave high from 21-Sep at 943.5 will at least defer and may threaten such a bullish count enough to warrant paring or neutralizing bullish exposure.
These issues considered, a bullish policy remains advised for longer-term commercial players with a failure below 970.7 required to pare exposure to more conservative levels and commensurately larger-degree weakness below 943.5 required to neutralize remaining exposure altogether. Shorter-term traders whipsawed out of exposure by the past month’s lateral cop are advised to reconsider a resume bullish policy and exposure from current 1009-area prices OB with a failure below 970.7 required to negate this call and warrant its immediate cover. In lieu of such sub-970.7 weakness, we anticipate a resumption of the 3-month uptrend to new highs above 1074.


