Posted on Mar 30, 2023, 08:20 by Dave Toth
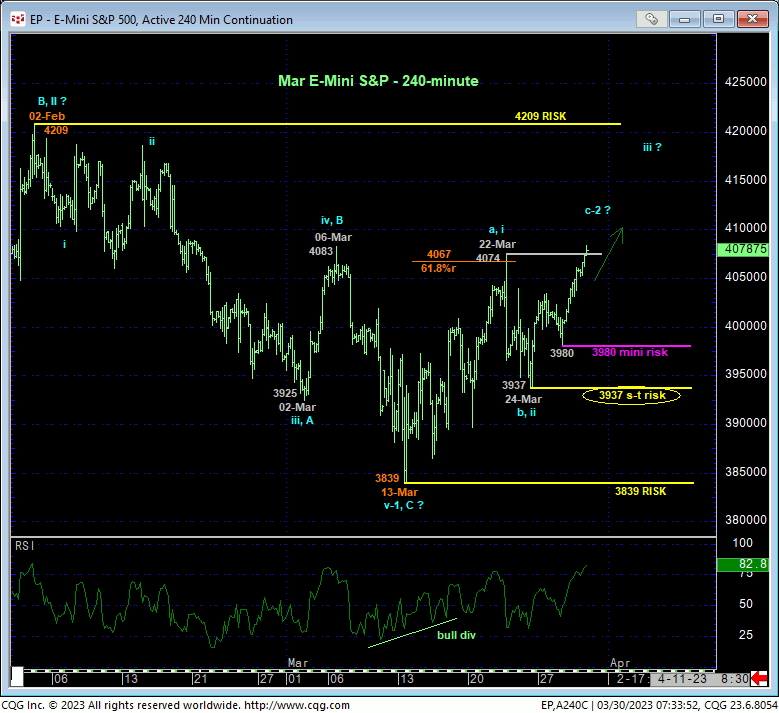
Overnight’s recovery above 22-Mar’s 4074 high shown in the 240-min chart below reaffirms and reinstates at least the intermediate-term uptrend with the important by-products being the market’s definition of recent smaller- and larger-degree lows at 3980, 3937 and especially 13-Mar’s 3839 low that the market would be expected to sustain gains above per any broader bullish count. Per such, these levels represent our new mini-, short- and long-term risk parameters from which non-bearish decisions like short-covers and bullish punts can be objectively based and managed.

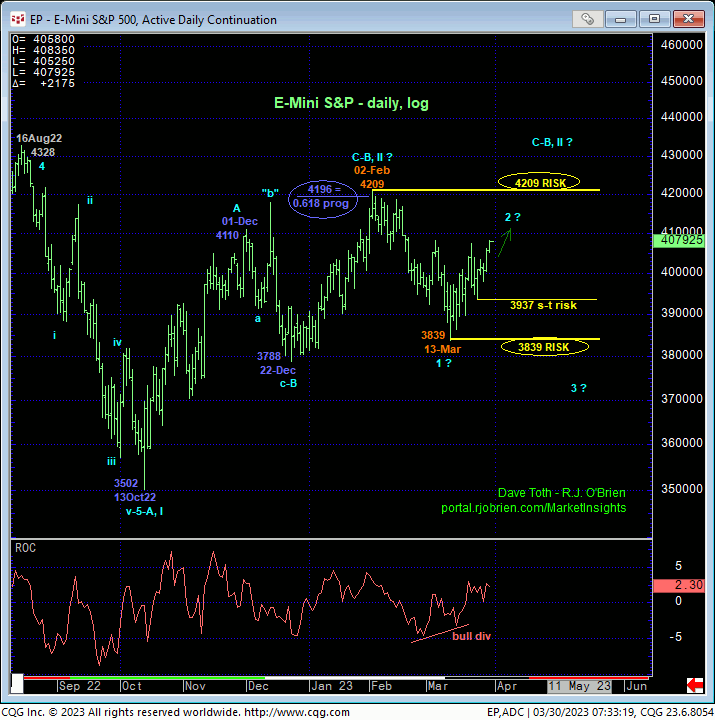
Stepping back, the ongoing recovery from 13-Mar’s 3839 low is likely one of two things: a (2nd-Wave) corrective rebuttal to Feb-Mar’s decline within a broader bearish count OR the resumption of Oct-Feb’s broader uptrend. If the latter bullish count is what the market has in store, it is incumbent on the bull to BEHAVE LIKE ONE by sustaining trendy, impulsive, increasingly obvious behavior to the upside, leading to a blow-out above 02-Feb’s 4209 high and still-arguable bear risk parameter. Setbacks below 3980 and 3937 will defer and threaten such a bullish count while a failure below 3839 will contribute to a peak/reversal count that could lead to a resumption of last year’s major bear trend to new lows below last Oct’s 3502 low.
The risk parameters to an interim bullish count are specific and objective at 3980, 3937 and especially 3839 for longer-term players and investors. We will be watchful for a recovery-stemming bearish divergence in short-term momentum between spot and 02-Feb’s 4209 high that could provide an early threat against this bullish count.

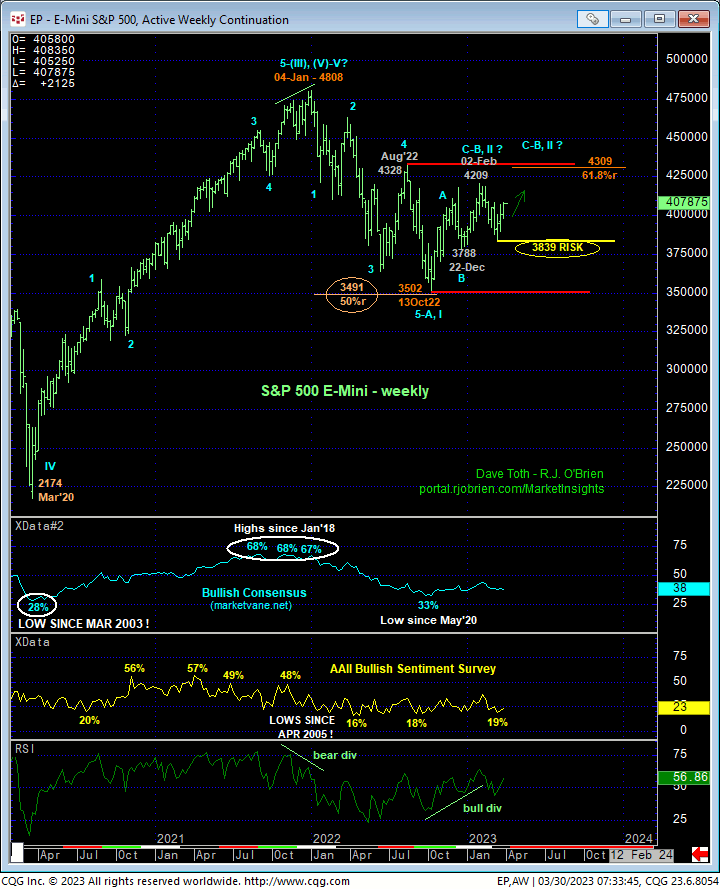
On a broader weekly basis, the chart below still shows the market deep within the bowels of a lateral range that dates from May of last year. Aimless whipsaw risk has been and remains typical of such rangey environments where directional risk/reward metrics are poor, warranting a more conservative approach to risk assumption. This non-trending behavior is either corrective/consolidative ahead of an eventual resumption of last year’s downtrend that preceded it OR a broader reversal of it. Further gains above at least 02-Feb’s 4209 high remain required to reinforce a broader bullish count. This said, even those gains would still leave the market shy of the (4309) 61.8% retrace of last year’s entire slide and well within the bounds of a correction within a secular bear market that could produce levels well below last Oct’s 3502 low.
The bottom line on this longer-term basis is that if last year’s sell-off COMPLETED a correction within the secular bull market, again, it is incumbent on the bull to BEHAVE LIKE ONE by sustaining trendy, impulsive price action above recent corrective lows like we’ve identified above; price action like that from Mar’20’s 2174 low to Jan’22’s 4808 high shown below. This requirement will remain and be especially important if/when the market takes our Feb’s 4209 high.

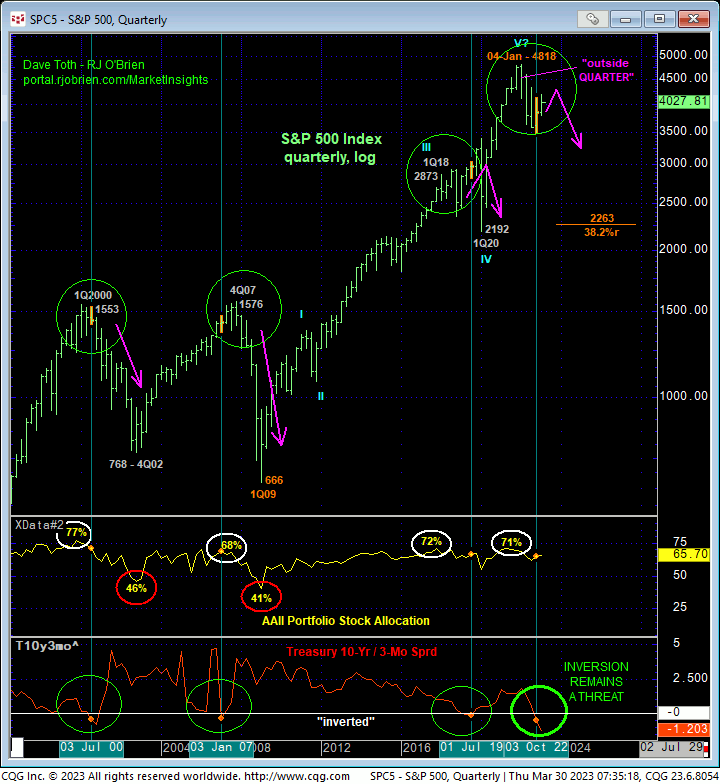
Finally and on an even broader quarterly log scale basis, the chart below shows the key factors on which our long-term peak/reversal count is predicated:
- a bearish divergence in monthly momentum (actually only visible on a monthly chart)
- an “outside QUARTER down” in 1Q22
- historically extreme bullish sentiment
- an inverted yield curve, and
- an arguably complete and massive 5-wave Elliott sequence that dates from 2009’s 666 low.
To negate this long-term bearish count the market needs to recoup 04Jan22’s 4818 all-time high in the Index (4808 in the futures contract). Recovery attempts shy of that threshold fall within the bounds of a major (B- or 2nd-Wave) corrective rebuttal to last year’s slide ahead of a resumption of that slide to new lows below last Oct’s 3502 low.
These issues considered, traders and investors are advised to move to a cautious bullish stance with a failure below 3980 required to threaten this call enough for shorter-term traders to move back to neutral. Commensurately larger-degree weakness below 3839 is required for longer-term institutional players and investors to not only neutralize bullish exposure, but also reverse into a new bearish policy ahead of what at that juncture could be steep losses. In lieu of weakness below at least 3980, further lateral-to-higher prices are anticipated. And again, we will keep a keen eye on MOMENTUM and any recovery-stemming bearish divergence in short-term mo between spot and 02-Feb’s 4209 high that could be an early threat against a broader bullish count.


