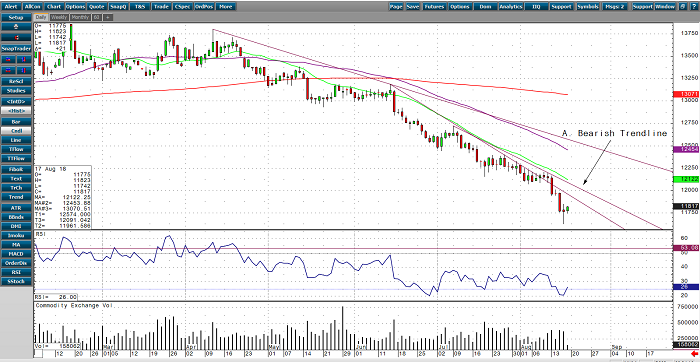
In the early morning trade, October gold is currently trading slightly up at $1,181.1 and it’s still trying to find a bottom after over a $200 selloff since the high was made back in January of $1,386.0. However, gold did snap back over $20 off its lows from yesterday but has failed so far this morning to show signs of it continuing. The possible near-term low in gold yesterday was slightly due to a weakened US dollar and rhetoric that US/China trade talks were back on for next week was seen as a positive.
Picking a bottom in any market is never easy, so for me to get bullish on gold again, I would need to see it get and close above a bearish trendline that started back on July 9 and comes in roughly around $1,210.0. If the shiny one can do that, then look for a rally up to $1,250-$1,275 an ounce. I highlighted these levels below on my RJO PRO daily October gold chart.
Gold Oct ’18 Daily Chart


