NOV SOYBEANS
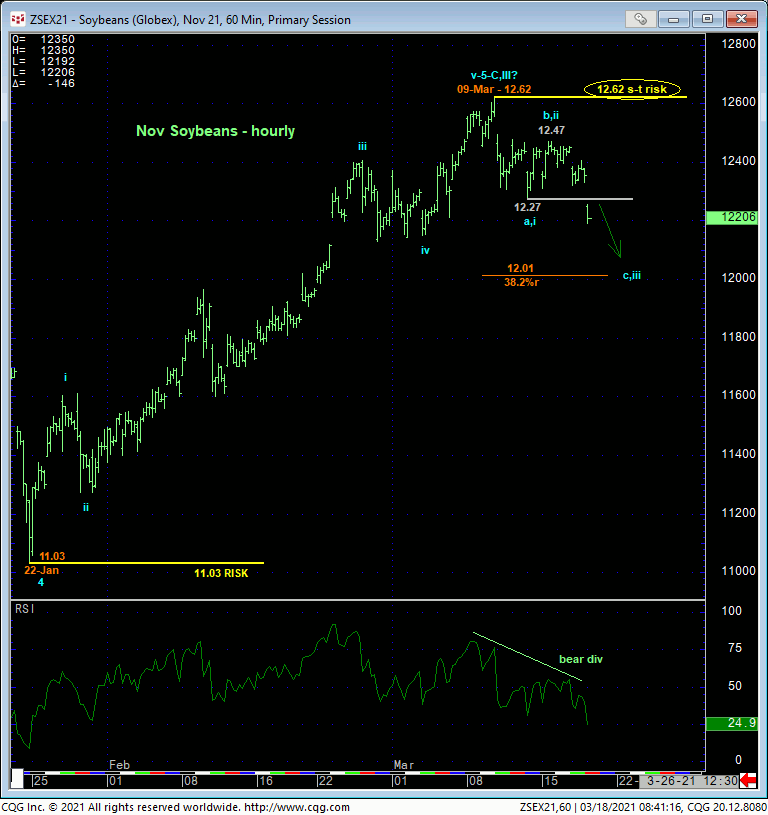
The hourly chart below shows this morning’s break below last Fri’s 12.27 initial counter-trend low that confirms a bearish divergence in short-term momentum. This mo failure defines 09-Mar’s 12.62 high as the end of a 5-wave Elliott sequence up from 22-Jan’s 11.03 next larger-degree corrective low, exposing at least a correction of this portion of the secular bull trend. But given the longer-term prospect that the rally from 11.03 might be a sequence-completing 5th-Wave, the extent to which this market might now be vulnerable to a correction or reversal should not be underestimated.
As a direct result of this admittedly short-term mo failure, we are defining 09-Mar’s 12.62 high as our new short-term risk parameter from which non-bullish decisions like long-covers and cautious bearish punts can be objectively based and managed.

As always, we cannot conclude a larger-degree correction or reversal from proof of just smaller-degree weakness like a failure below 12.27. Indeed, it remains clear that commensurately larger-degree weakness below 22-Jan’s 11.03 next larger-degree corrective low and key long-term risk parameter remains required to break the major uptrend from Apr’20’s 8.26 low. In effect then, we have the short-term trend as down within the long-term trend that remains arguably up. So what does the market have in store between 12.62 and 11.03?
The daily log chart below shows former resistance from the 12.02-to-11.97-area that, since broken in late-Feb, now serves as a new support candidate. The 38.2% retrace of Jan-Mar’s 11.03 – 12.62 rally in the hourly chart above cuts across at neighboring 12.01. Per such, this general-12.00-area would be one to beware a relapse-stemming bullish divergence in momentum needed to arrest the short-to-intermediate-term slide and perhaps re-expose the secular bull. Much of a break below about 11.95 would be the next reinforcing evidence of a broader peak/reversal threat.

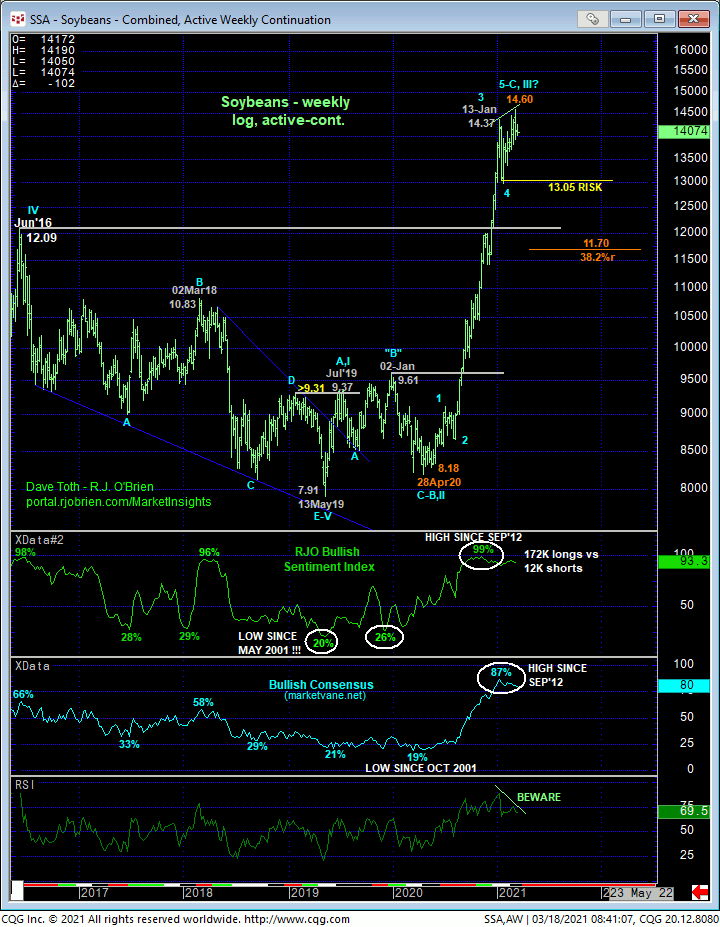
Finally and also incriminatingly, the weekly log active-continuation chart below (that’s currently reflecting May prices) shows:
- waning upside momentum
- historically frothy sentiment not seen since 2012’s infamous peak and reversal and
- an arguably complete 5-wave Elliott sequence up from last year’s 8.18 low.
This is a unique and compelling list typical of major peak/reversal environments, so it’s not hard at all to envision today’s short-term weakness as the embryonic start to a correction r reversal lower that could be major in scope. Again, it would be grossly premature to CONCLUDE a major reversal following just short-term weakness below 12.27. But until and unless negated by a recovery above 12.62, neither should we ignore the prospects of such a reversal.
These issues considered, shorter-term traders are advised to neutralize bullish exposure at-the-market and to even consider a cautious bearish position from the 12.27-to-12.32-range with a recovery above 12.62 negating this call and warranting its immediate cover. Longer-term players are advised to pare bullish exposure to more conservative levels and neutralize remaining exposure altogether on a commensurately larger-degree failure below 11.03. A break below the approximate 11.95-area would be the next reinforcing step to a broader peak/reversal count while a recovery above 12.62 would obviously reinstate the major bull.


