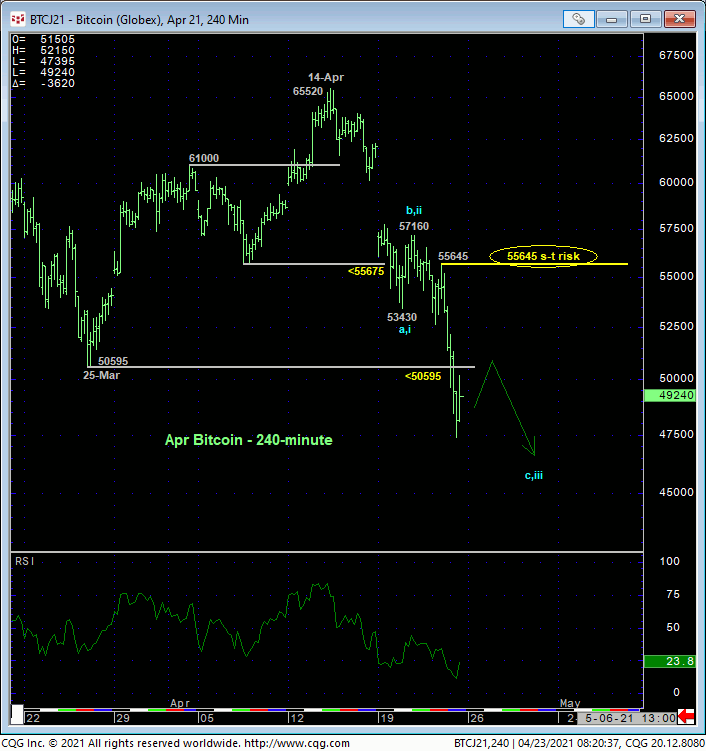
Today’s continued slide below 25-Mar’s 50595 next larger-degree corrective low in the Apr contract confirms a bigger level of weakness and vulnerability and reinforces our shorter-term bearish count discussed in Mon’s Technical Blog following that day’s short-term momentum failure below 07-Apr’s 55675 corrective low. This continued slide leaves yesterday’s 55645 high in its wake as the latest smaller-degree corrective high this market is now minimally required to recoup to arrest what is at least an intermediate-term downtrend and possibly just the start of a more protracted correction or reversal lower. Per such, this 55645 level serves as our new short-term risk parameter from which traders can objectively rebase and manage non-bullish decisions like long-covers and cautious bearish punts. This short-term risk parameter is thus “trailed” down from 14-ASpr’s 65520 high as a direct result of this continued weakness.
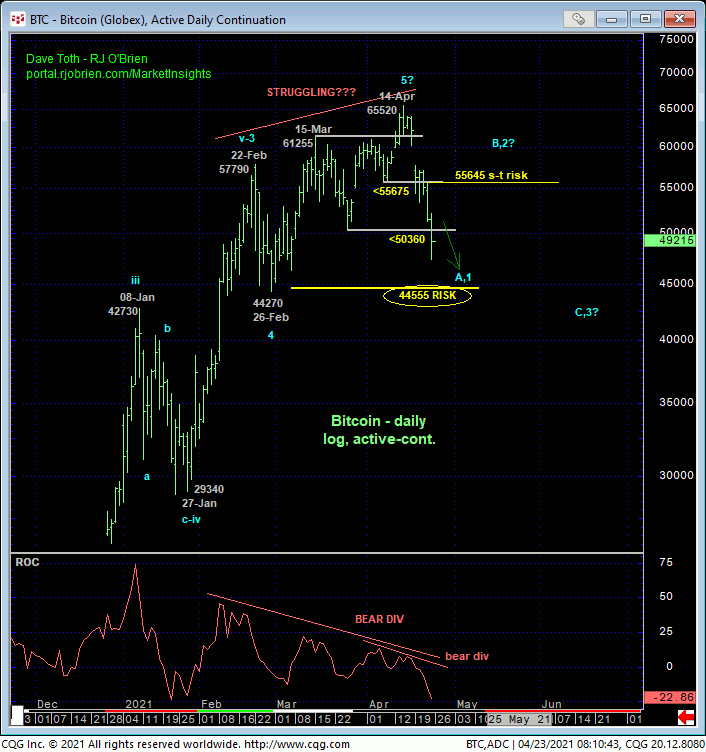
The developing weakness is easy to see in the daily chart of the contract above, where today’s break below 25-Mart’s 50360 larger-degree corrective low confirms a bearish divergence in daily momentum that raises the odds that 14-Apr’s 65520 high might be one of a larger scale and the start of a major correction or reversal lower. Given the magnitude of the secular bull trend however, there’s one remaining level- 26-Ferb’s 44555 low in the then-prompt mar contract that long-term bulls can still require a failure below to, in fact, break the major bull trend and warrant a move to the sidelines. Regardless, it is clear that the past TWO MONTHS’ waning upside momentum is coming home to roost and threatening one of the great bull runs we’ve seen in many years.
This said and relative to that secular advance, even the past few days’ setback still falls well within the bounds of a mere correction within the still-arguable major bull trend. But if this is the case, this market has now defined two distinct levels at 55645 and 65520 that the bull must recover above to threaten or mitigate a broader peak/reversal threat and re-expose the secular uptrend. Until and unless such strength is shown, and especially if the market weakens further below 44555, traders and investors should not now be surprised by further and potentially protracted losses ahead.
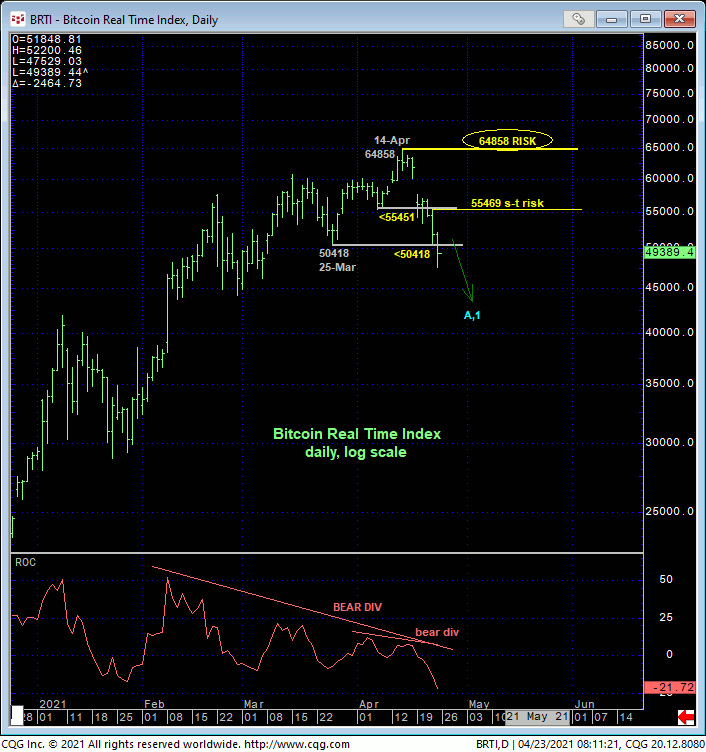
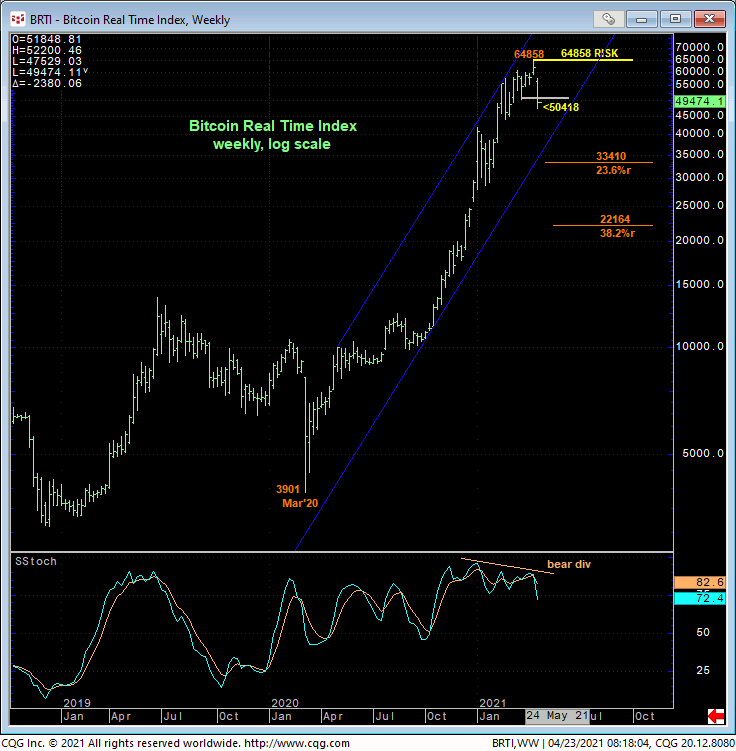
The daily (above) and weekly (below) log scale charts of the underlying Bitcoin Real Time Index takes the sometimes vague monthly futures contracts “roll” out of the equation and provides the purest indication of this market. The clear momentum failure a least threatens the bull and warns of a more protracted correction lower, and possibly a more extensive reversal. While the depth of either a correction or reversal is indeterminable at this juncture, the levels this index must recoup to threaten or negate a bearish count are not. These bear risk parameters are specific and objective at yesterday’s 55469 high from a short-term perspective and 14-Apr’s 64858 from a long-term perspective. Until and unless these levels are recouped, at least the intermediate-term trend is confirmed as down, and possibly the new major trend. Indeed, even a Fibonacci minimum 23.6% retrace of Mar’20 – Apr’s 21’s 3901 – 64858 rally doesn’t cut across until the 33400-area.
These issues considered, shorter-term traders have already been advised to move to a neutral/sideline position following Mon’s sub-55675 failure. Longer-term institutional players are likewise advised to move to the sidelines to circumvent the depths unknown of a correction or reversal lower that could be major in scope. We will be watchful for a relapse-stemming bullish divergence in short-term momentum to define a more reliable low and support from which the risk of a resumed bullish policy can only then be objectively based and managed. In lieu of such a mo failure, further and possibly protracted losses should not surprise.