Posted on Mar 16, 2023, 10:04 by Dave Toth
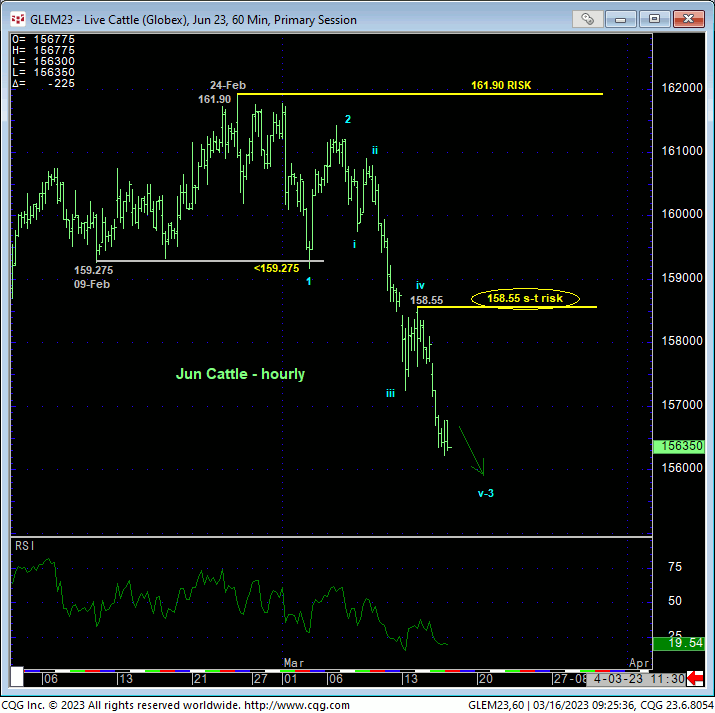
In Mon’s Technical Blog we discussed that day’s bearish divergence in short-term momentum in the Apr contract that was of an insufficient scale to conclude a broader top but to beware of the early stages of exactly such a broader top. Moving to an hourly chart of the now-prompt Jun contract below, this market confirmed a similar short-term mo failure with 02-Mar’s break below 09-Feb’s 159.275 corrective low, defining 24-Feb’s 161.90 high as one of developing importance. The EXTENT and impulsiveness of the past week’s subsequent fallout has rendered 24-Feb’s 161.90 high even more important and, we believe, the prospective END to the secular bull market. In this regard, this 161.90 level is considered our new long-term risk parameter from which even long-term commercial players can objectively base non-bullish decisions like long-covers.
From a short-term perspective, yesterday’s continued slide leaves Tue’s 158.55 high in its wake as the latest smaller-degree corrective high from which shorter-term traders with tighter risk profiles can objectively rebase and manage the risk of non-bullish decisions like long-covers and cautious bearish punts.


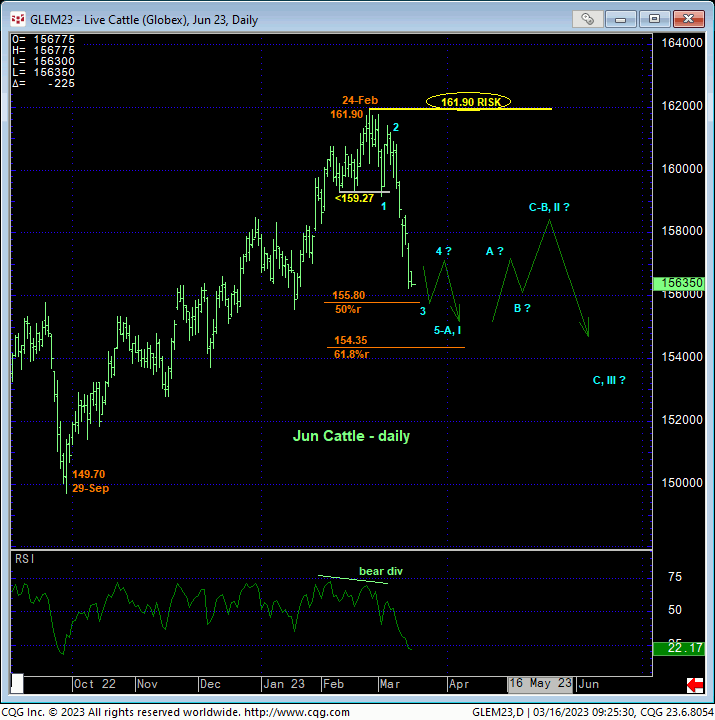
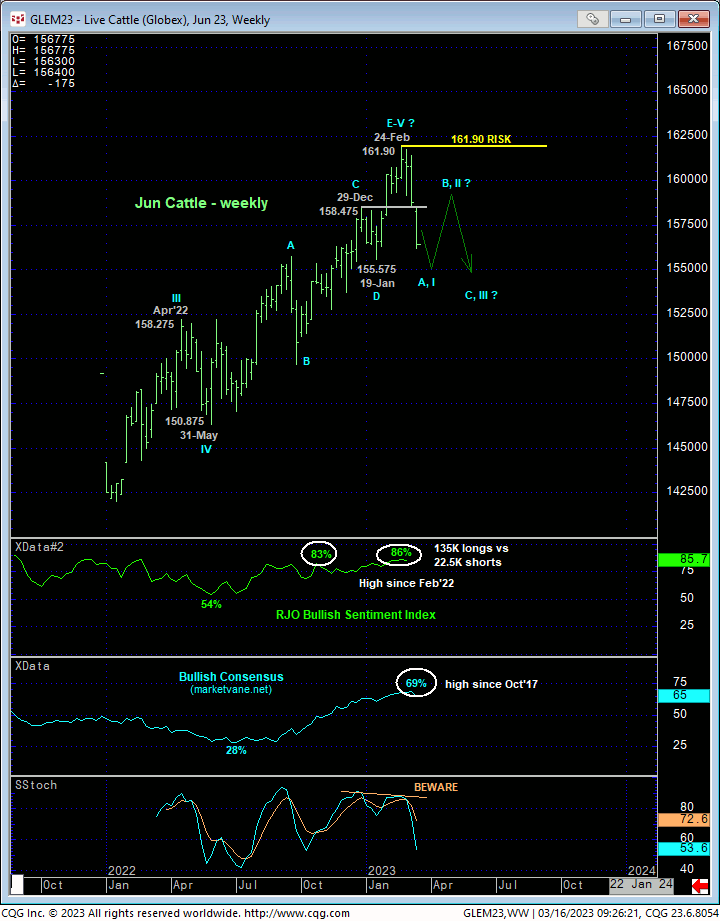
On a broader scale shown in the daily chart above and weekly chart below of the Jun contract, while the market has yet to fail below 19-Jan’s 155.575 larger-degree corrective low needed to confirm a bearish divergence in weekly momentum, we believe the extent and impulsive of the past couple weeks’ sell-off is more than sufficient to conclude 24-Feb’s 161.90 high as one of developing importance from a longer-term perspective, especially given the backdrop of understandable and historically frothy levels of bullish sentiment/contrary opinion. Indeed, such an extent of bullishness is TYPICAL of major peak/reversal environments.
This said, at best, the market has only satisfied the first two of our three key reversal requirements; a momentum failure of a scale sufficient to threaten the long-term trend and proof of trendy, impulsive 5-wave behavior on the initial counter-trend sell-off attempt. The key third requirement- proof of 3-wave corrective behavior on a subsequent recovery attempt- has yet to be satisfied.
The long-term forces that have driven the massive THREE-YEAR secular bull market are not going to just evaporate into thin air, exposing a direct move south. Rather, the market will come to grips with eroding bullish forces over TIME that contributes to a peak/reversal PROCESS that typically include a countering (B- or 2nd-wave) corrective rebuttal to the initial (A- or 1st-wave) swoon. While the past week’s decline warns of further losses immediately ahead, in the WEEKS ahead we will be watchful for a countering bullish divergence in short-term momentum needed to arrest this clear and present downtrend, complete a 5-wave sequence down from 161.90 and expose what could be an extensive but corrective rebound. Following such a corrective recovery that falls short of 24-Feb’s 161.90 high and that is stemmed by another bearish divergence in momentum, the risk/reward metrics of a new bearish policy and exposure could be as long-lived as that that followed Nov 2014’s all-time high.

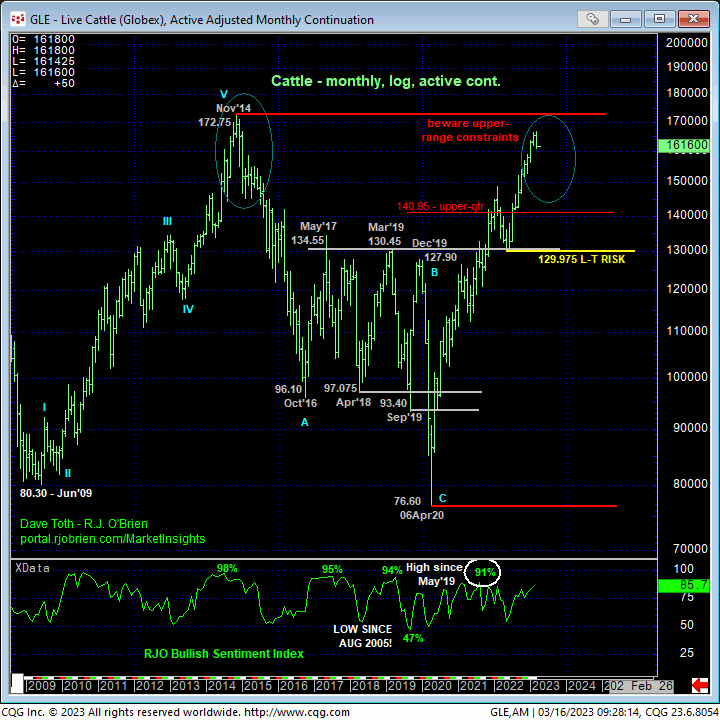
The monthly log active-continuation chart below shows the market’s current proximity to the extreme upper recesses of its historical range, a precarious position for bulls to say the least. COMBINED with such frothy bullish sentiment/contrary opinion levels and the extent and impulsiveness of the past few weeks’ sell-off, traders are advised to prepare for a peak/reversal process that we believe will be gargantuan in scope. Per such, a neutral/sideline policy remains advised for shorter-term traders as the risk/reward merits of chasing bearish exposure “down here” are poor. Longer-term commercial players are advised to neutralize remaining bullish exposure and also move to a neutral/sideline position, waiting for a corrective rebound for a preferred risk/reward opportunity to initiate a new bearish policy that could span quarters or even years.


