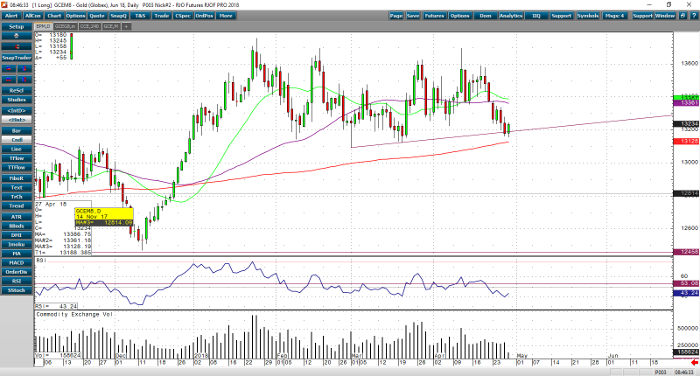
In the early morning trade, gold has received a slight bump up and is currently trading at $1,322.9. Gold has been under pressure all week mostly due to the explosion of a rally in the US dollar. So far the positive peace talks between North and South Korea have also helped put some pressure on the shiny one as it puts the risk on trade to the sidelines. This morning’s better than expected US GDP numbers of 2.3% probably gave June gold a mini boost up after a big selloff this week. However, there are signs that the US economy is slowing just a bit, which might minimize this short-term rally in gold along with a damaging chart pattern.
If we take a quick look at the daily June gold chart, you’ll clearly see the technical damage and the big weekly selloff. The last two times that gold has traded down to these levels it has been able to rally back up around $40 a troy ounce. As long as gold is trading above its 200-day moving average, which is at $1,312.8, then the shiny one will be able to find gold buyers/bulls at these levels. However, if you see it close below the 200-day, then it opens itself up to a huge sell off back to the December 12 low of $1,247.2.
Gold Jun ’18 Daily Chart


