In what is now the second week of inventory builds, the EIA Petroleum status report saw a 2.4 million barrel increase, compared to last week’s 3.0 million barrel build. The increase in WTI inventories could be a result of the ability for US production, particularly from the Dakota and Oil Sands, to increase with the favorable (above $60) prices. I have talked extensively in the past on why the $60 to $65 price per barrel threshold is significant for multiple stakeholders and producers in the global crude oil complex. It almost entirely comes down to the profitability to produce oil, and the $60 to $65 per barrel threshold is the cost for most wells less than 30 years old. The higher costs associated with younger wells, is due in part to a higher employment cost, drilling and surveying costs; for a new well none of those costs have been recouped yet.
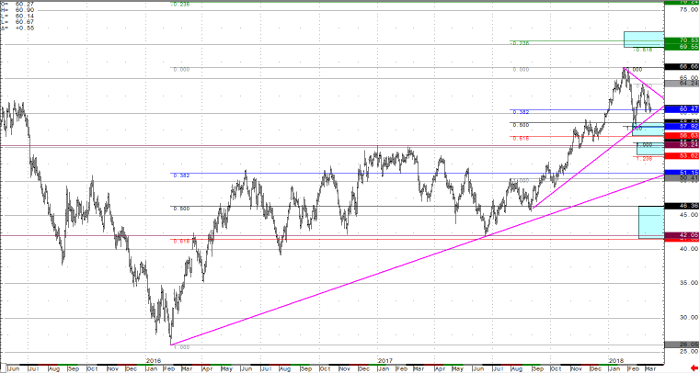
With the increase in oil production, as well as a clear week-over-week build in inventory numbers, the reversal lower for oil prices (and range bound price action between $65 and $60), is basically in line with expectations of a fundamental force at work. While a Fibonacci support zone has already provided a bounce from the $58.50 to $58.00 inflection zone (blue boxes on chart), however, now the market has also held resistance into the $64.00 to $65.00 area. Upside technical targets form $58.00 could take the WTI crude price to the $68.00 to $70.00 objectives, but with price holding below $65.00 there is a chance to break back below $60.00 at this time. Below the $58.00 inflection zone, are the $54.50 trend line and Fibonacci 100% extension inflection zone, as well as the much larger $46.36 full 50% Fibonacci retracement inflection zone. Either of these supportive areas would be logical downside targets if the price of WTI crude breaks lower.
In my opinion, the rally that took WTI crude prices to the $66.66 continuous contract highs into the end of 2017 and start of 2018 is (still) taking a mild pause. Fundamental supply and drilling ramp ups, along with the return of the Keystone Pipeline, are reason to believe there is healthy and ample supply in crude inventories to keep prices capped. Of course there are black swans that could change this dynamic in a second (i.e. war in the Middle East, or a shutdown of the Keystone pipeline again), but it’s important to remember a market’s ability to remain irrational for longer than your account can remain positive. Look for WTI crude oil prices to remain stagnant in this $5.00 range in the near-term, and look for early indications of the markets ability to break out of that range. The market will resolve itself one way or another (on a long enough timeline), and it is up to the trader to define risk and carry their trade to target after confirmation.
Crude Oil Daily Continuation Chart


