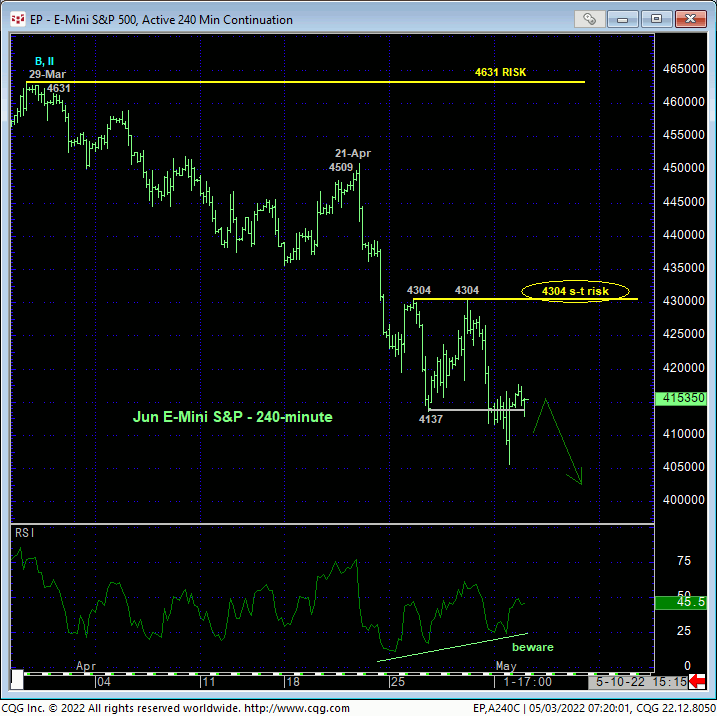
Fri and yesterday’s break below last Tue’s 4137 low reaffirms and reinstates not only the resumed slide from 29-Mar’s 4631 high, but also this YEAR’S major peak/correction/reversal count from 04-Jan’s 4808 all-time high. On a short-term basis detailed in the 240-min chart below, this resumed slide leaves Thur’s 4304 high in its wake as the latest smaller-degree corrective high. A recovery above this level is now minimally required to confirm a bullish divergence in short-term momentum needed to at least interrupt and possibly arrest a broader bearish count. Until and unless such 4304+ strength is shown, the trend is down on all practical scales and should not surprise by its continuance or acceleration straight away. Per such, this 4304 level serves as our new short-term risk parameter from which shorter-term traders with tighter risk profiles can objectively rebase and manage the risk of a still-advised bearish policy and exposure.
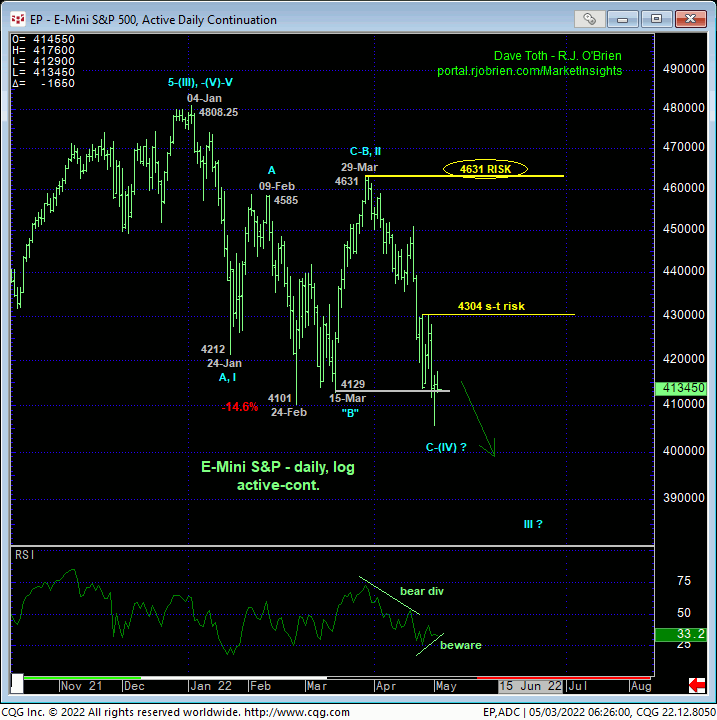
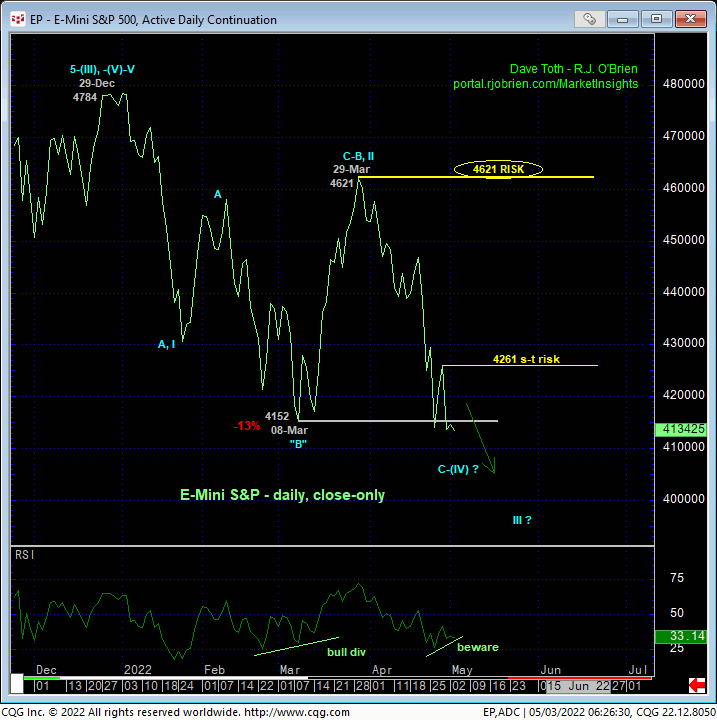
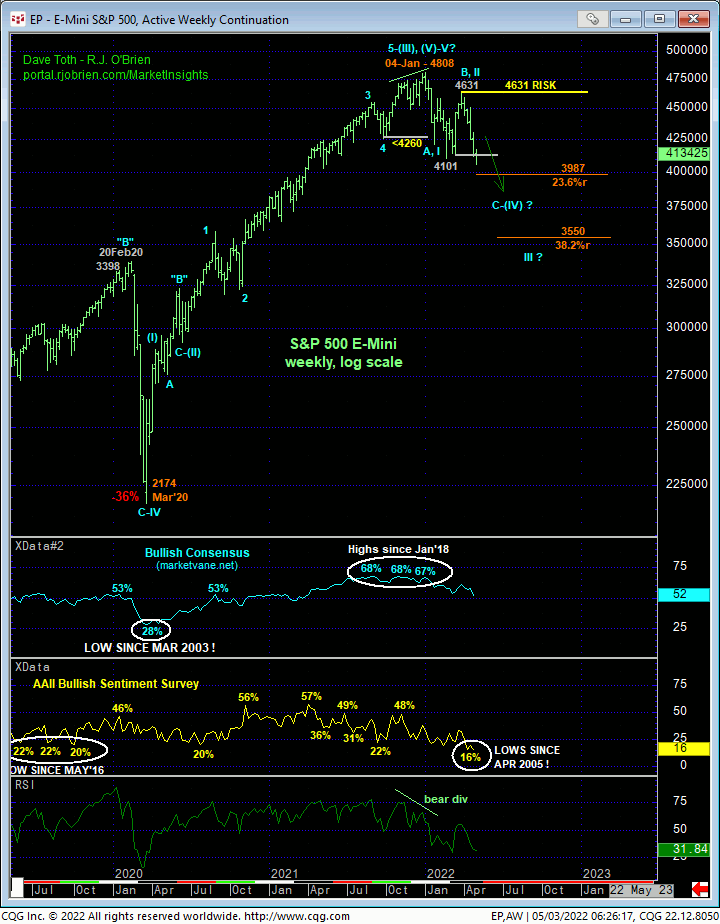
On a broader scale, the daily high-low chart above and close-only chart below show the past week’s break of the pertinent Mar and Feb lows that, in fact, reinstates and reaffirms our major peak/correction/reversal count introduced in 18-Jan’s Technical Blog. As noted above, a recovery above at least Thur’s 4304 smaller-degree intra-day corrective high or a close above that day’s 4261 corrective high close is now minimally required to even defer, let alone threaten a bearish count and that could have grave ramifications for months or quarters ahead. But to truly mitigate such a broader bearish count, this market needs to recoup 29-Mar’s 4631 intra-day high or close above that day’s 4621 larger-degree corrective high close. Such commensurately larger-degree strength is needed to render the entire sell-off attempt from 04-jan’s 4808 all-time a 3-wave and thus corrective affair and re-expose the secular bull trend.
TO THIS POINT, this year’s decline is clearly only a 3-wave affair and remains well within the bounds of a major BULL MARKET correction. IF this is the case however, then the bull needs to arrest the 4-month, 3-wave sell-off attempt RIGHT NOW, first with a smaller-degree recovery above 4304 and subsequently with larger-degree strength above 4631. Such strength would then allow us to objectively classify the decline from 4631 as the completing c-Wave to a major bull market correction.
The only other wave classification for the decline from 4631 is the dramatic 3rd-Wave of a major reversal lower. 3rd-waves are characterized by trendy, impulsive, sustained and increasingly obvious behavior lower with few respites. And with the technical elements on which a broader bearish count is predicated still intact, traders and investors should hardly be surprised by further and possibly steep, even relentless losses straight away.
The weekly log chart shows the past week’s resumption of Jan-Feb’s initial counter-trend decline that reinforces our broader bearish count and puts the onus on the bull to prove strength above the levels specified above to =threaten and then negate this count. Traders are reminded of the technical facts that warn of a major peak/correction/reversal count:
- a confirmed bearish divergence in not only weekly, but also MONTHLY momentum that, in absolute fact, breaks the uptrend from at least Mar’20’s 2174 low
- historically frothy levels in the Bullish Consensus (marketvane.net) measure of market sentiment/contrary opinion
- an arguably complete 5-wave Elliott sequence from Mar’20’s 2174 low as labeled in the weekly log chart below that ….
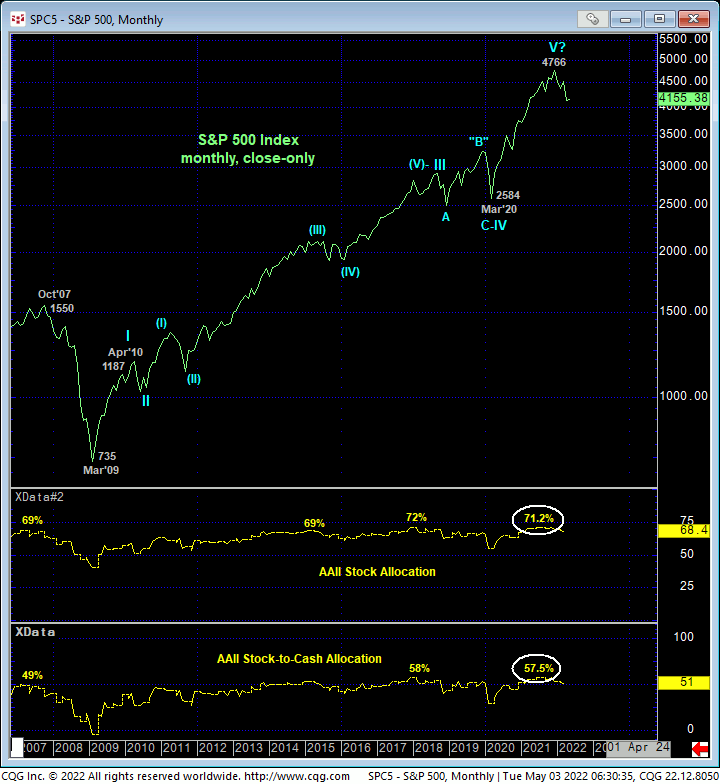
- …arguably completes an even longer-term 5-wave Elliott sequence from Mar 2009’s 735 low monthly close as labeled in the monthly chart above
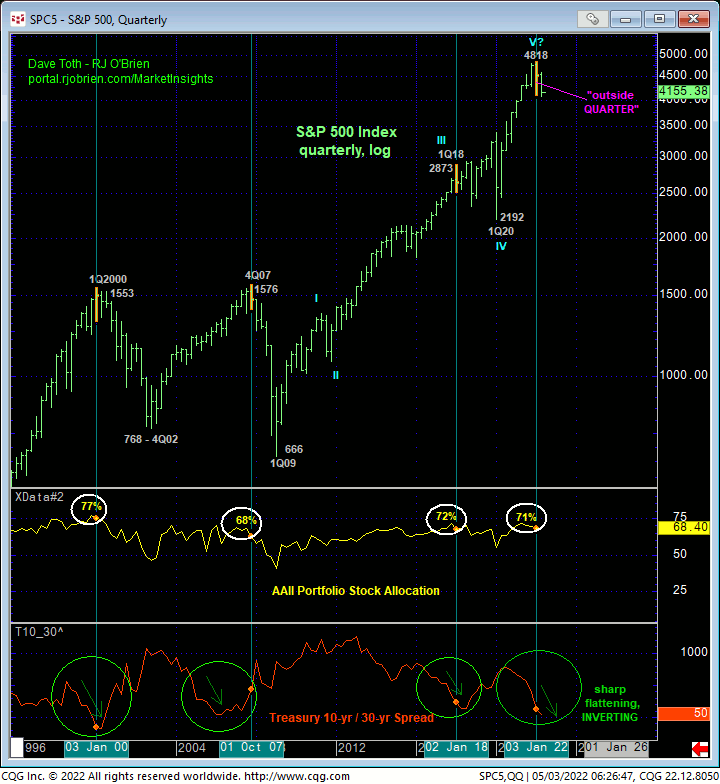
- an unheard of “outside QUARTER” in 1Q22 (higher high, lower low and lower close than 4Q21’s range and close)
- historically extreme levels in AAII portfolio stock and stock-to-cash allocation shown above and below, and
- a sharp flattening and close-to-inverting spread between Treasury 10-yr and 30-yr rates.
With the exception of an arguably subjective (on our part) Elliott wave count (but which remains a considered opinion and observation), ALL of these technical facts warned of an accompanied each of the three major market corrections or bear markets in Jan’18, 4Q07 and 1Q2000 as indicated in the quarterly log chart below. Until and unless deferred or negated by a recovery above 4631, further and possibly severe, multi-quarter losses should not come as a surprise.
The technical key here is our specific and objective definition of bear risk at 4631 and, from a short-term perspective, 4304. This is the precise level this market needs to recoup to mitigate a bearish count and re-expose the secular bull. By sharp contrast, bulls have NO objective level below the market that they can specify as to where their bullish argument and exposure is wrong and should be neutralized. As is typically the case under such down-trending environments, investors “hope” for the market to bottom out and recover. Hope is not an investment strategy. These issues considered, a bearish policy and exposure remain advised with a recovery above at least 4304 required to defer or threaten this call and warrant paring or neutralizing exposure. In lieu of such strength, further and possibly accelerated losses to indeterminable but potentially extreme levels are anticipated.
