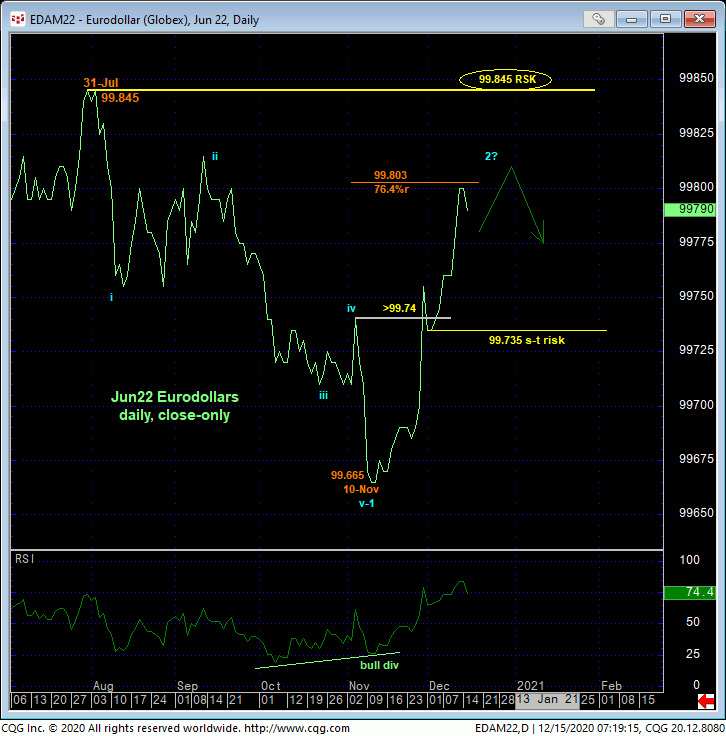
Moving out the Jun22 contract, the daily close-only chart below shows that 30-Nov’s close above 04-Nov’s 99.74 corrective high confirmed a bullish divergence in daily momentum. This mo failure defined 10-Nov’s 99.665 low as the end of a 5-wave Elliott sequence down from 31-Jul’s 99.845 all-time high close and we believe the (1st-Wave) start to a major reversal lower. On a major scale, 31-Jul’s 99.845 high is considered our key long-term risk parameter this market needs to close above to negate this peak/reversal count and reinstate the secular bull trend.
This said, the trend is clearly up on a smaller scale with the past couple weeks’ continuation of this recovery leaving 01-Dec’s 99.735 low close in its wake as the latest smaller-degree corrective low the market is now required to sustain gains above to maintain a more immediate bullish count and possibly negate our longer-term peak/reversal count. Per such, this 99.735 low is considered our new short-term risk parameter from which non-bearish decisions like short-covers and cautious bullish punts can be objectively based and managed.
In effect, we believe the market has identified 99.,735 and 99.845 as the key directional triggers heading forward. Traders are advised to toggle directional biases and exposure around these flexion points commensurate with their personal risk profiles.

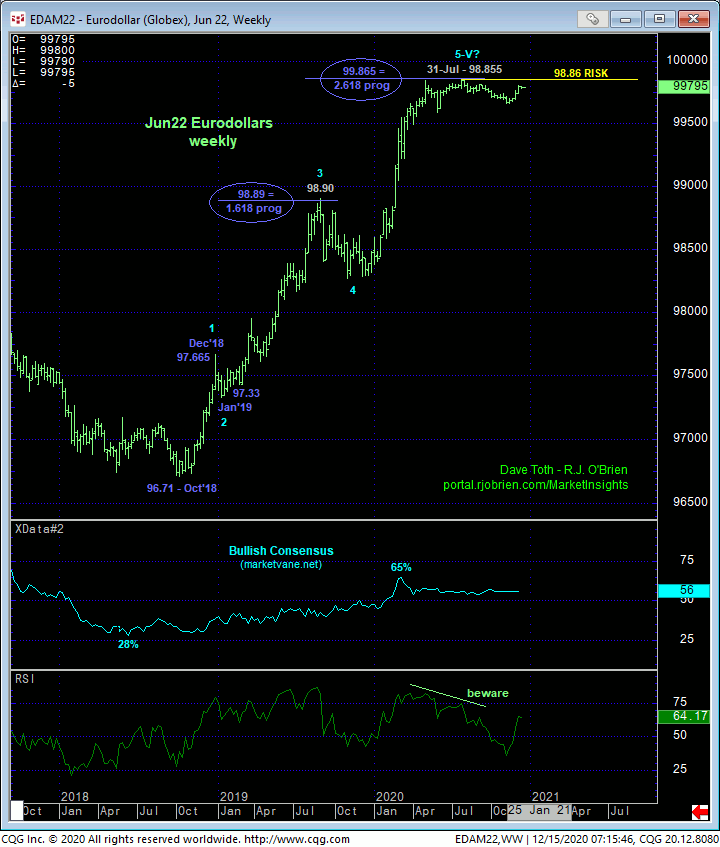
From a long-term perspective and as with the Dec21 contract before, we believe the rally from Oct’18’s 96.71 low is a complete or nearly complete 5-wave Elliott sequence as labeled in the weekly chart below. Earlier this year, market sentiment reached its most bullish level since that that warned of and accompanied Sep’17 – Oct’18’s major downtrend. Additionally, upside momentum has been waning since May.
Against this sentiment and momentum backdrop it’s also quite interesting to see that the prospective 3rd-Wave in our count below was within one basis point of the (98.89) 1.618 Fibonacci progression of Oct-Dec’18’s 96.71 – 97.665 1st-Wave while the entire distance of Waves-2-thru-5 came within one basis point of the (99.865) 2.618 progression of that 1st-Wave.
These issues considered, a neutral/sideline policy is advised for shorter-term traders as the risk/reward merits of a bullish policy :”up here” around the upper-quarter of a range that arguably dates back to May are poor. Longer-term institutional players remain advised to maintain a bearish policy and exposure with a close above 99.845 required to negate this call and warrant its cover. A relapse below 99.735 will reinforce our peak/reversal count that could be massive in scope.


