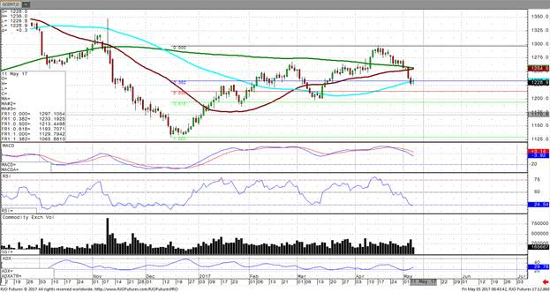
June gold futures have seen quite the pullback since the mid April highs near 1300. It’s been quite shocking to see the collapse of gold given the amount of geopolitical uncertainty in the world. Much of this decline can be attributed to capital liquidation, easing of political tension in the French election, and a breakdown in the technical on the chart. Although the selling seems to have eased this morning, I do not believe a low has been put in just yet. There is some minor support around 1225, but the real support does not come in until the all-important technical and psychological level of 1200. The funds both spec and hedge are net long 211,000 contracts, and more long liquidation is still a real possibility. The fears of US rate hikes are still in the market, however, the trade does not appear to be focused on this. Indian gold demand also rose 15% in the first quarter. It’s something that is not to be focused on, but it is something that should help contain the $70 slide we have seen in gold.
If you look at this from a technical perspective the bears are firmly in control, and anyone who is bullish needs to know this. We are currently trading beneath the 50, 100, and 200 day moving averages. Your first sign to sell gold was a break below the 200 day on May 1. The MACD has crossed indicating a sell just days before the breach of the 200 day. The cross was on April 25. These are both strong signals in any market to watch for position traders. A Fibonacci retracement from contract lows of 1129 to the highs at 1297 shows a 50% support level at 1215. A 62% retracement comes in at just below 1200. Gold should continue to slide, and any support found near 1200 should be a buying opportunity.
Jun ’17 Gold Daily Chart


