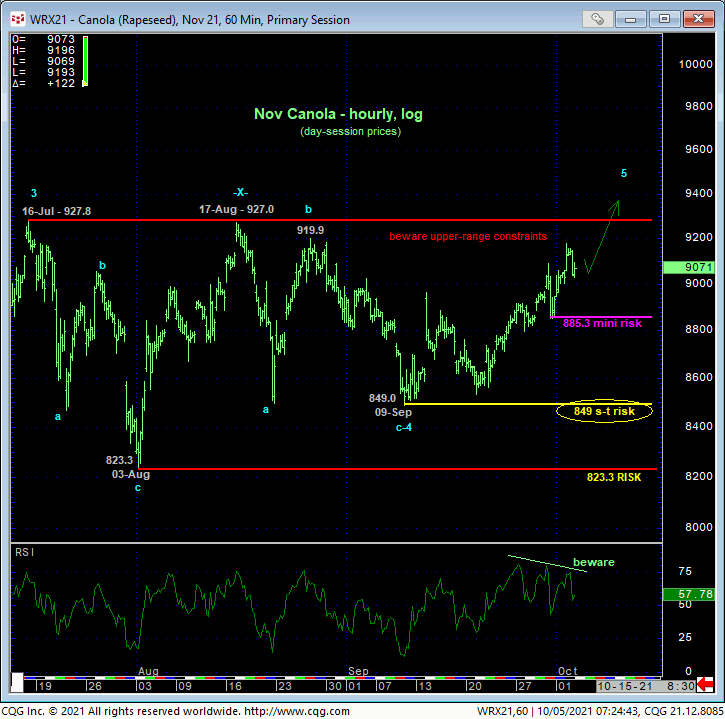
The past couple weeks’ steady recovery is consistent with our longer-term bullish count discussed in 15-Sep’s Technical Blog. Per the hourly chart below, this recovery leaves corrective lows in its wake of various scales at 885.3, 849 and 823.3 that serve as our mini, short- and long-term risk parameters from which a bullish policy and exposure can be objectively rebased and managed. While we fully anticipate a resumption of the secular bull trend following 2-1/2 MONTHS of mere lateral, consolidative price action, the fact that upper-range resistance around the 927-handle in day-session prices remains intact maintains the prospect for further intra-range relapses within this consolidation. Herein lies the relevance and importance of Thur’s 885.3 mini risk parameter where a failure below this level will confirm a bearish divergence in short-term momentum and break the past couple weeks’ uptrend. Shorter-term traders with tighter risk profiles are advised to use this level to protect longs.

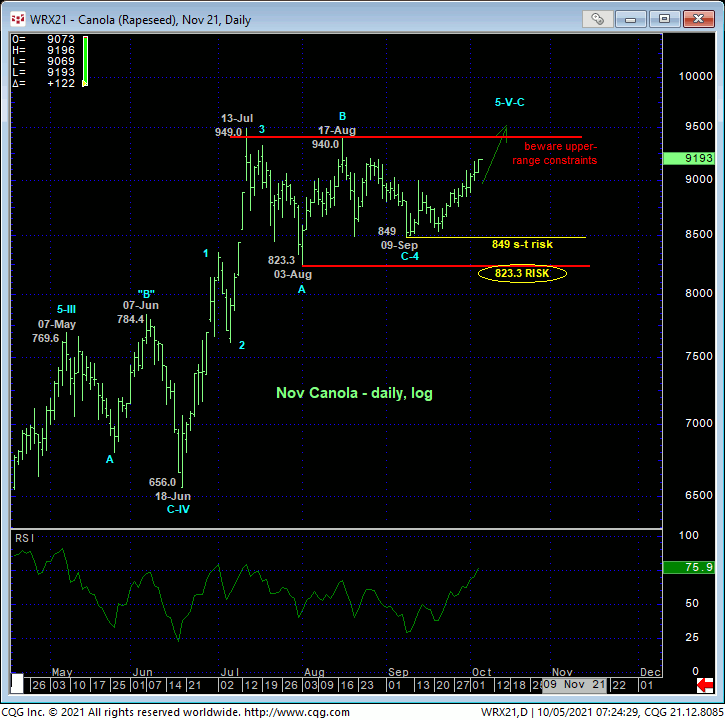
Stepping back to a daily basis, the chart below shows the past 2-1/2 months’ lateral chop that, on the heels of Jun-Jul’s uptrend, let alone the secular bull trend, has to be considered a corrective/consolidative event that warns of a resumption of the uptrend that preceded it. On this broader scale, a relapse below at least 09-Sep’s 849 corrective low and especially 03-Aug’s 823.3 larger-degree corrective low is required to threaten and then negate our bullish count. Until such larger-degree weakness is proven, an eventual resumption of the secular bull trend to new highs above that key 927-handle-area in day-session prices remains expected.
“Overnight” highs in Aug and Jul show levels around 940 and 949 that may or may not be broken. We place little technical merit on these levels. Once above 928, it will be totally incumbent on the bull to continue to BEHAVE LIKE ONE by sustaining trendy, impulsive behavior higher thereafter. For long-term reasons, its failure to do so and a subsequent bearish divergence in momentum could expose major peak/reversal conditions and opportunities.


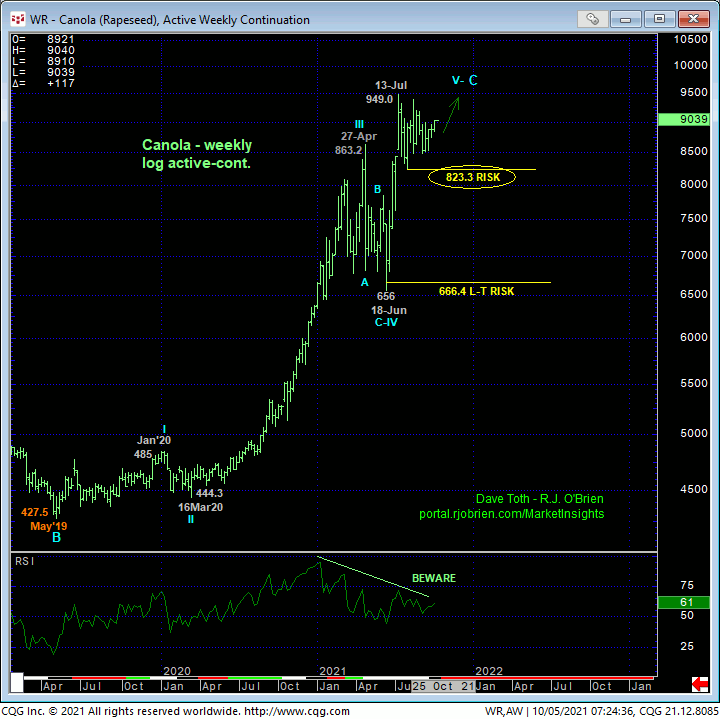
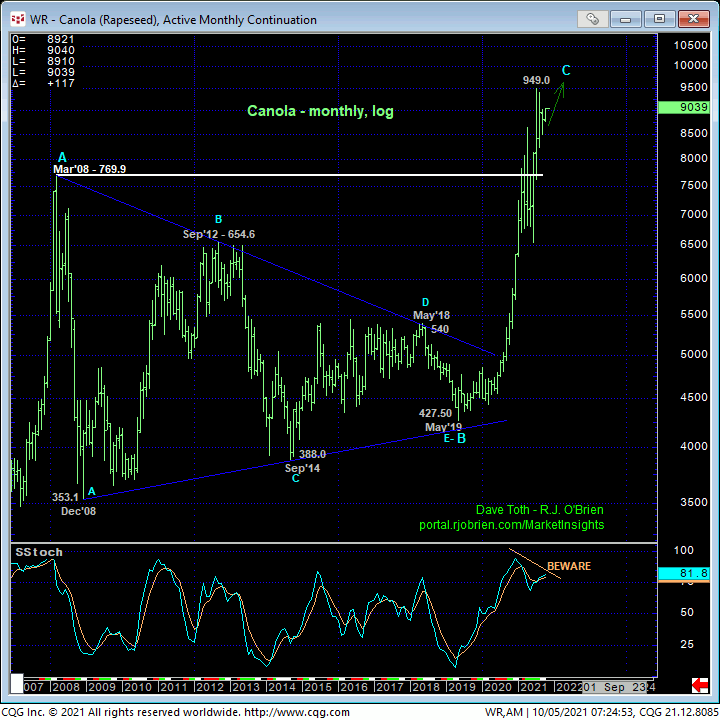
On an even broader scale, the weekly (above) and monthly (below) log scale charts show the magnitude of the secular bull market that reached and has sustained all-time highs for months following Mar/Apr’s break above 2008’s 769.9 previous all-time high. This trend remains our “friend”. However, waning upside momentum is clear as is the prospect that this market may be at the end of a massive 5-wave Elliott sequence from May’19’s 427 low where both Mar-Jun and Jul-Sep’s corrective stints are arguably the 4th-Wave slowdowns of the trend before a final 5th-Wave gasp that the market fails to sustain. We will be watching very closely for this behavior typical of peak/reversal processes as the opportunities from the bear side thereafter could be magnificent and span quarters or years. Until and unless the market even threatens, let alone breaks the clear and present uptrend with a momentum failure however, further and possibly accelerated gains remain expected.
These issues considered, a bullish policy and exposure remain advised with a failure below 885.3 required for shorter-term traders to move to the sidelines temporarily to circumvent the depths unknown of another intra-range relapse. Long-term commercial players are OK to pare bullish exposure on a sub-885.3 failure, acknowledging and exchanging whipsaw risk (above whatever high is left in the wake of such a sub-885.3 mo failure) for deeper nominal risk below 823.3, where all bullish bets are off. In lieu of a failure below at least 885.3, we anticipate a break above 16-Jul’s 927.8 high in the resumption of the secular bull trend.


