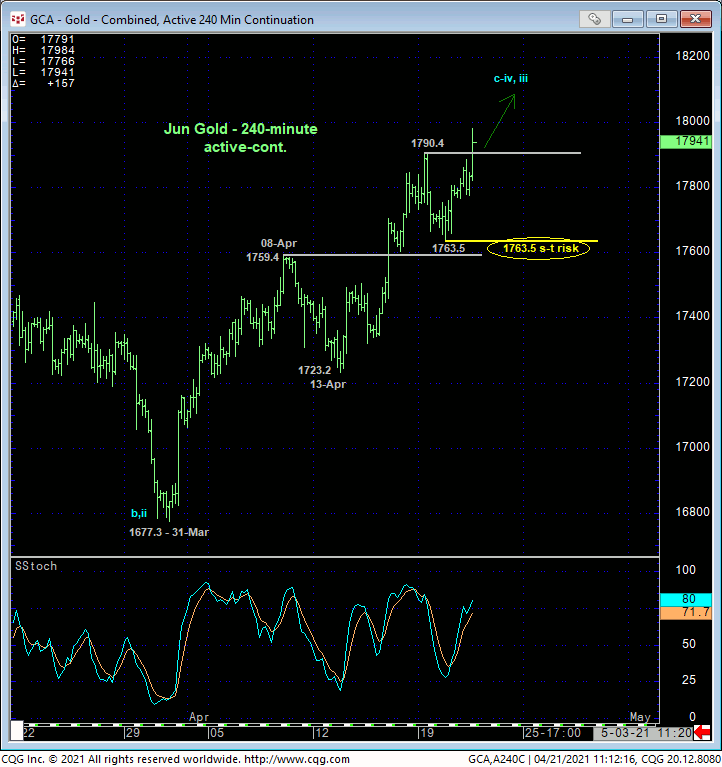
JUN GOLD
Today’s continued strength, this time above Mon’s 1790.4 high, reaffirms at least the intermediate-term uptrend introduced in 08-Apr’s Technical Webcast and leaves yesterday’s 1763.5 low in its wake as the latest smaller-degree corrective low this market is now minimally required to fail below to stem the rally and perhaps re-expose the broader downtrend that dates from 07Aug20’s 2089 all-time high. In this short-term regard, this 1763.5 level serves as our new short-term risk parameter from which shorter-term traders can objectively base non-bearish decisions like short-covers and cautious bullish punts.
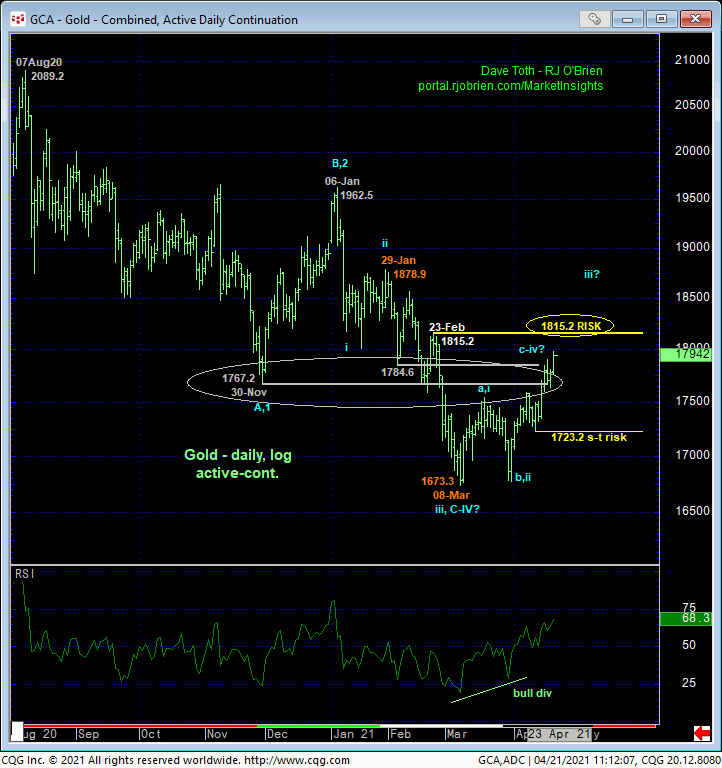
The real story however revolves around the market’s ability thus far to recover above key former 1760-to-1785-area support-turned-resistance that is arguably a key component to a BASE/reversal of the 7-month downtrend from Aug’20’s 2089.2 high. The daily log scale chart above shows the bullish divergence in momentum that certainly defines 08-Mar’s 1673.3 low as one of developing importance. But given the magnitude of the 7-month downtrend, ever since that early-Mar portion of the plunge we’ve had 23-Feb’s 1815.2 larger-degree corrective high as our key long-term risk parameter the market minimally needed to recoup to raise the odds that the entire Aug’20 – Mar’21 sell-off attempt was a 3-wave and thus corrective affair that would re-expose the secular bull trend to new all-time highs above 2089.
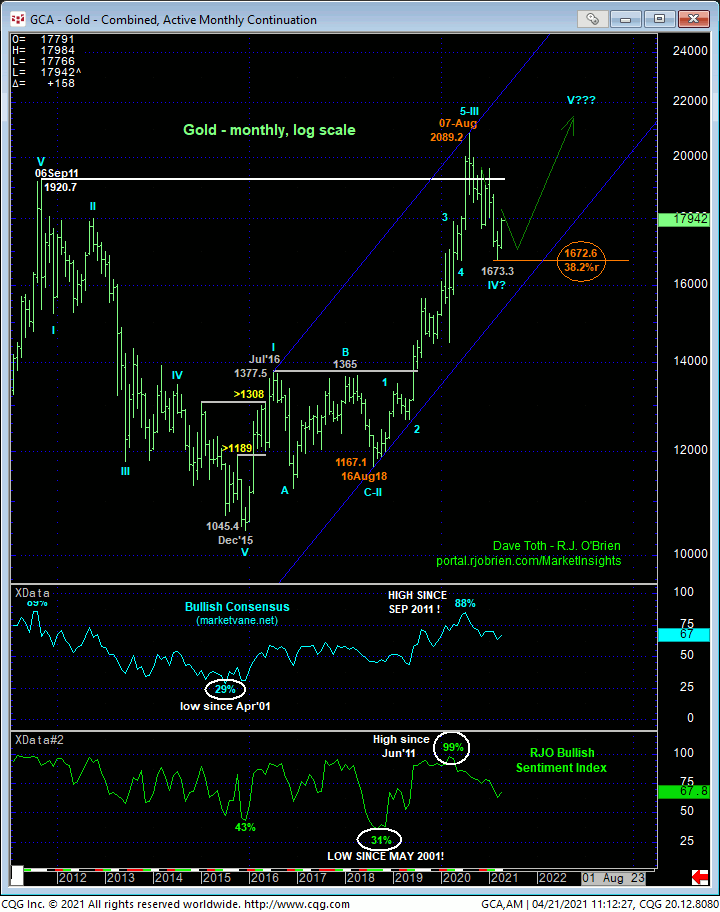
As we’ve discussed many times in this blog since mid-Mar’s initial recovery attempt, the entire sell-off from last year’s high has only unfolded into a 3-wave affair as labeled. Furthermore, it stalled in very close proximity to a pair of Fibonacci retracement and progression relationships in the 1672-to-1660-area. If/when this thing recovers above 1815.2 needed to, in fact, break at least Jan-Mar’s downtrend, these Fibonacci relationships, bullish divergence in daily momentum and erosion in sentiment levels not seen since 2019 would be complicit in a long-term base/reversal count that could be extraordinary, warning of a resumption of the secular bull market to new highs above 2089.
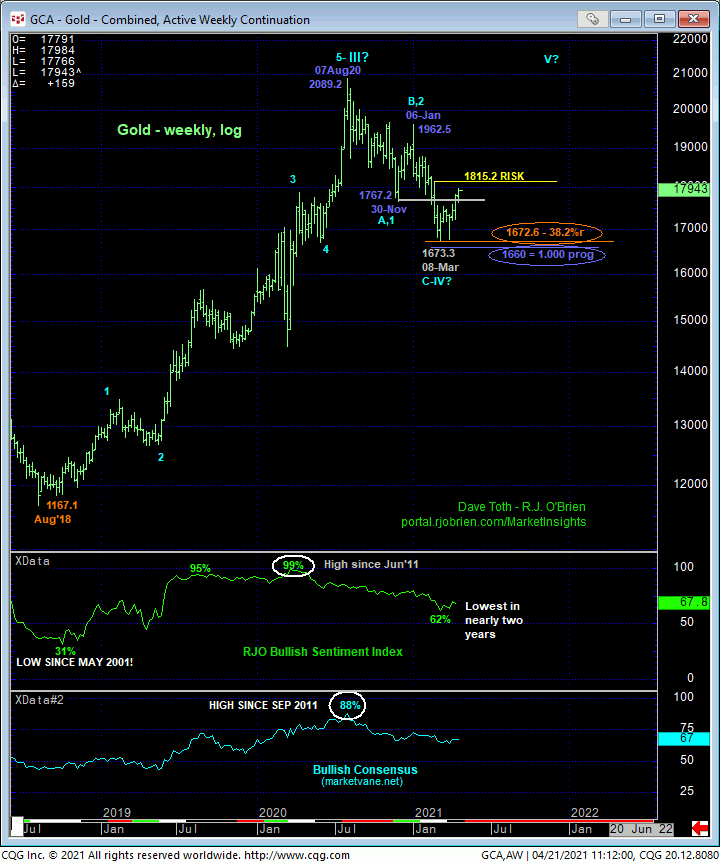
Indeed, stepping back to consider the historical perspective in the monthly log scale chart below, Aug-Mar’s mere and exact 38.2% retrace of Aug’178 – Aug’20’s 1167 – 2089 (prospective 3rd-Wave) falls well within the bounds of a (4th-Wave) correction that would then presumably yield to a (5th-Wave) resumption of the bull to at least one more round of new highs above 2089.
These issues considered, shorter-term traders with tighter risk profiles remain advised to maintain a cautious bullish policy and exposure with a failure below 1723.2 required to negate this specific call and warrant its cover. Longer-term players are advised to pare bearish exposure to even more conservative levels and jettison the position altogether on a recovery above 1815.2, at which point a reversal into a new bullish policy would also be advised. In effect, we believe the market has identified 1815.2 and 1723.2 as the key directional flexion points heading forward. Traders are advised to toggle directional biases and exposure around these levels commensurate with their personal risk profiles.
MAY SILVER
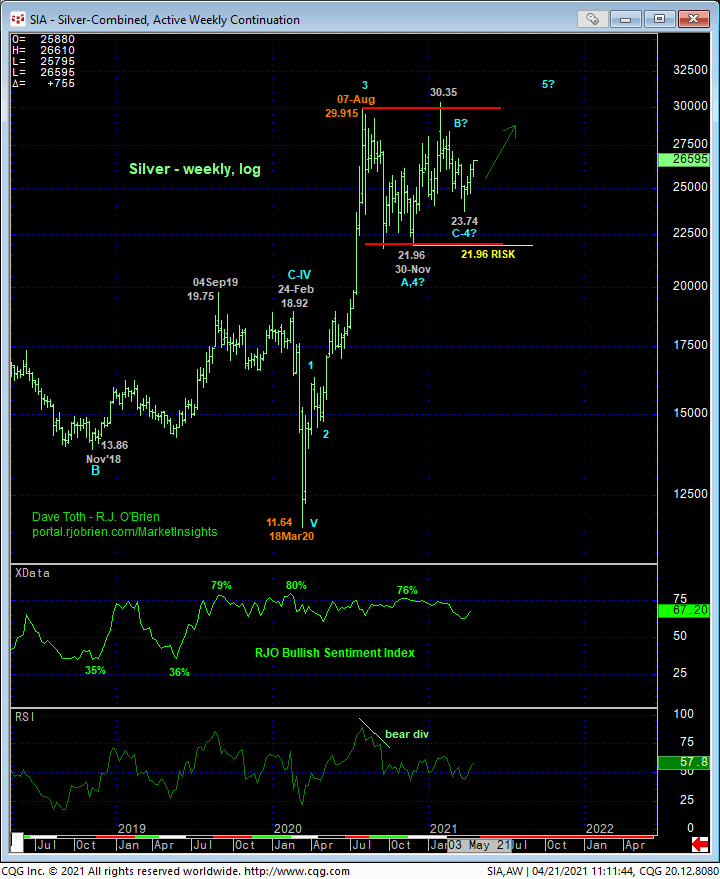
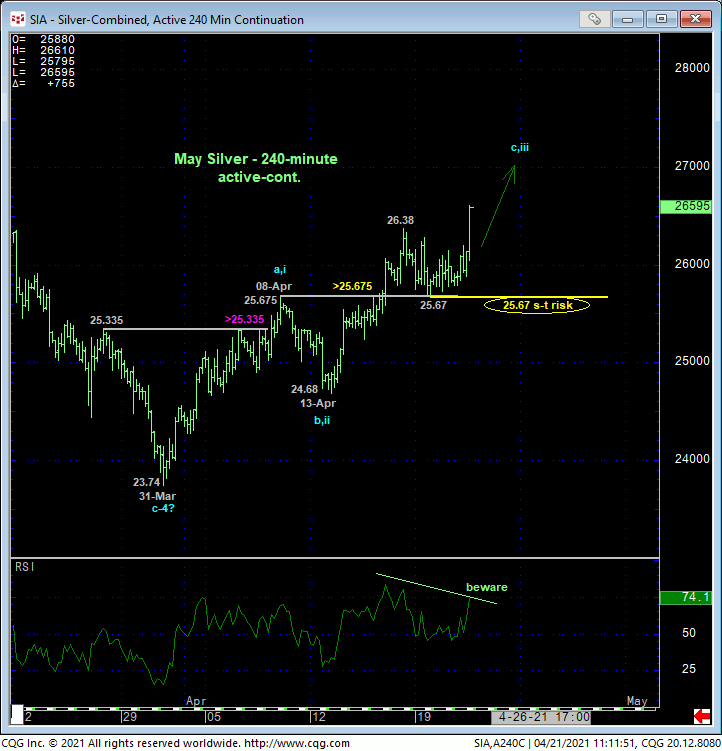
Especially given the developing bullish story in gold, today’s admittedly short-term continuation of strength above Fri’s 26.38 high could prove equally important, at least with respect to a smaller-degree corrective low and short-term risk parameter being defined by Mon’s 25.67 corrective low. A failure below at least 25.67 is now required to break the uptrend from at least 13-Apr’s 24.68 low and reinforce aimless range-center whipsaw. Until and unless such sub-25.67 weakness is proven, further and possibly accelerated gains straight away should not surprise.
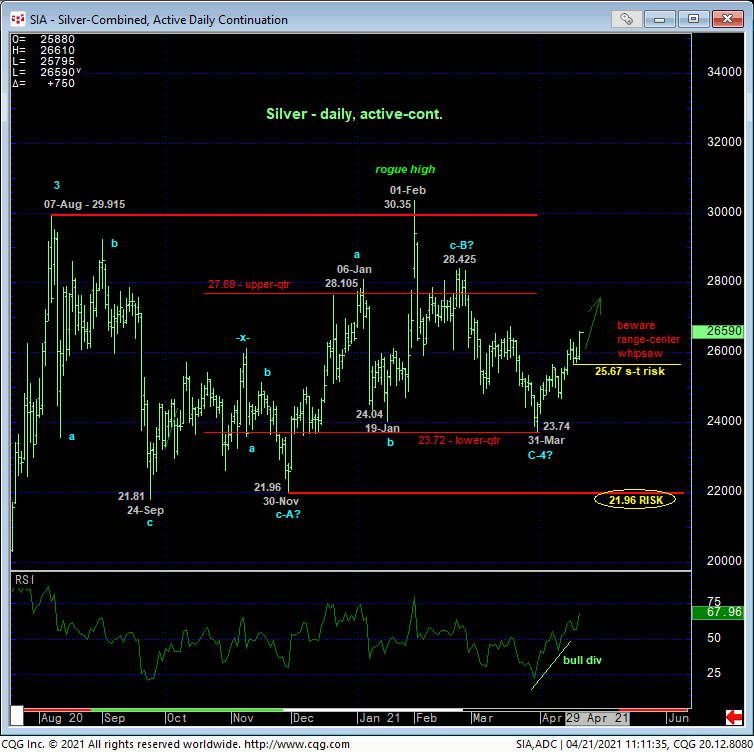
Stepping back, only a glance at the daily chart above and weekly log scale chart below is needed to see that this market remains deep within the middle-half bowels of an incessant range between 29.915 and 21.96 that dates from last year’s 07-Aug high. For months, we’ve urged traders to stay away from this market because the risk/reward merits of initiating directional exposure from the middle-half of this range were and are abhorrent.
This said however, the more that this market fails to make any trendy, impulsive moves south however, the greater the odds become that this mere lateral chop is a corrective/consolidative affair that warns of a resumption of the secular bull trend that preceded it. Commensurately larger-degree weakness below 30-Nov’s 21.96 lower boundary to this range remains required to negate this long-term bull market correction and expose a major reversal lower.
While aimless chop remains a threat, traders are nonetheless advised to move to a cautious bullish policy and exposure from 26.50 OB with a failure below 25.67 required to negate this specific call and warrant its cover. Relative to the broader range in question, this is a minor, conservative amount to risk in exchange for the possibility that the secular bull trend to eventual new highs above 29.915 is unfolding straight away.
