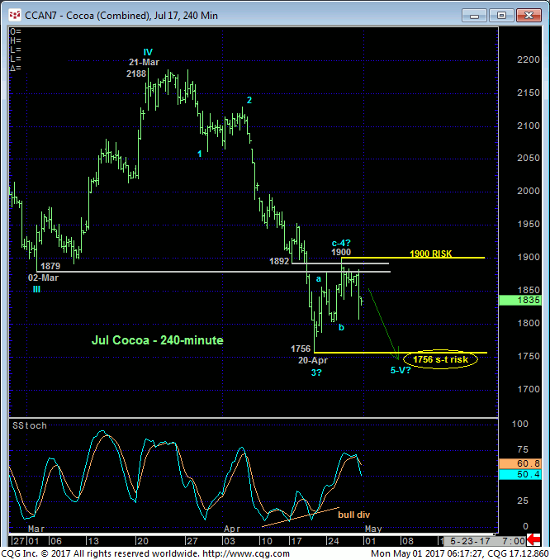
Against the backdrop of the secular bear market Fri’s relapse is enough to expose last Wed’s 1900 high as the end or upper boundary of a 3-wave and thus corrective affair up from 20-Apr’s 1756 low as labeled in the 240-min chart below. Per such that 1900 high is considered our new key risk parameter to a still-advised bearish policy calling for a resumption of the major bear to new lows below 1756.
Last Wed’s rally above 24-Apr’s 1877 initial counter-trend high confirmed a bullish divergence in short-term momentum that defined 20-Apr’s 1756 low as one of developing importance and a short-term risk parameter from which non-bearish decisions like short-covers and cautious bullish punts can still be objectively based and managed as long as that low holds.


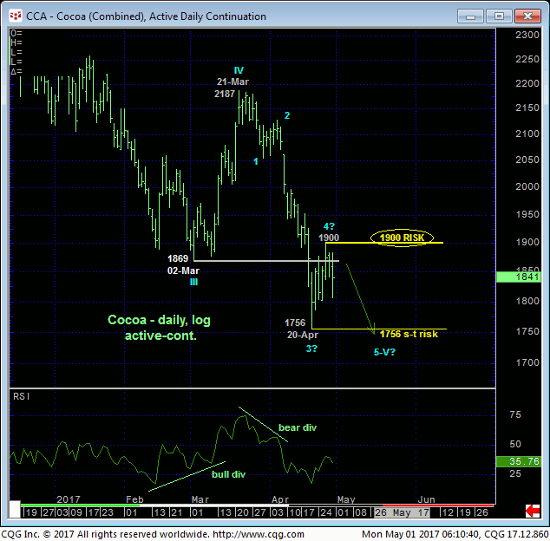
Taking a step back we believe that the late-Apr recovery attempt is merely the 4th-Wave correction of an eventual 5-wave sequence down from 21-Mar’s 2187 high to at least one more new low below 20-Apr’s 1756 low shown in the daily log scale chart above. Longer-term traders are warned however of the factors that could contribute to a major BASE/reversal-threat environment in the weeks ahead. These factors include:
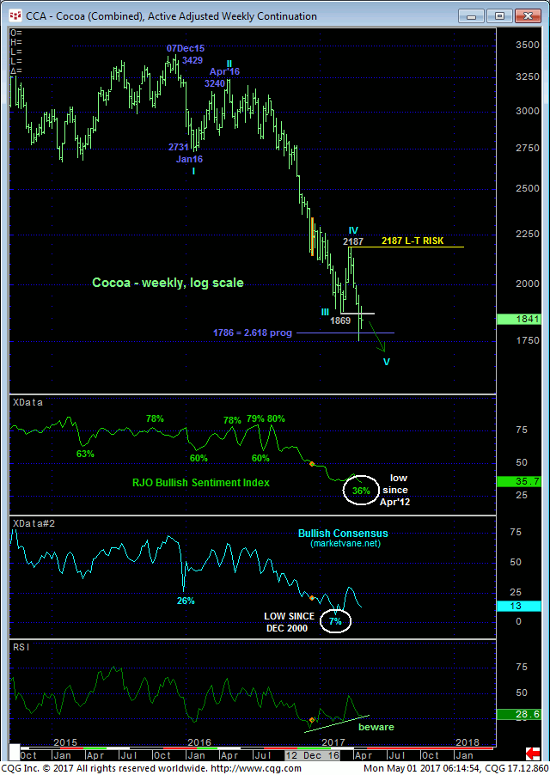
- the prospect that the secular bear market from Dec’15’s 3429 high may be completing a textbook 5-wave Elliott sequence as labeled in the weekly log scale chart below
- waning downside momentum and
- historically bearish sentiment not seen in at least five years.
NONE of these factors/threats mean anything as long as the simple but major downtrend of lower lows and lower highs remains intact. Herein lies the critical issue of identifying prior corrective highs like last week’s 1900 high and, on a broader scale, 21-Mar’s 2187 major corrective high.

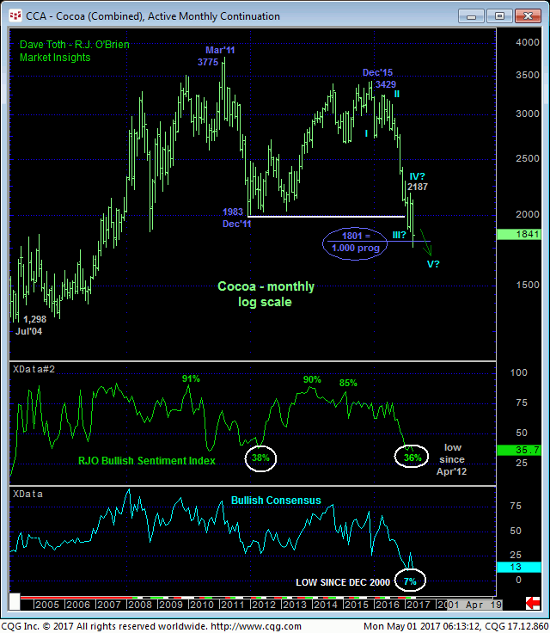
A final factor that could come into play with respect to a major base/reversal threat is the Fibonacci fact that the resumed bear from Dec’15’s 3429 high has spanned a length virtually identical (i.e. 1.000 progression) to 2011’s initial counter-trend decline from 3775 to 1983. Combined with the base/reversal threats listed above, it is imperative that the market sustain levels below at least 1900 to maintain a broader bearish count and policy.
These issues considered and while acknowledging 20-Apr’s 1756 low as support on at least an intermediate-term basis, a bearish policy and exposure remain with strength above 1900 required to not only negate this call and warrant its cover, but also reinforce a base/reversal-threat environment that could be major in scope.


