This week saw historic bearish movements with extreme volatility on all major global indices as countries digested the growing Coronavirus threat. This was driven in part by what some observers saw as a delayed response to the Pandemic by the US, as well as the active lockdowns on people movement initiated by several European countries, such as Italy.
It seemed at the time of writing that there was little to reassure the markets for the time being, although they may attempt to find support this coming week.
Traders should ensure they adopt rigorous risk management strategies, especially during a time of volatility. However, they could still find potential profitable opportunities across other asset classes.
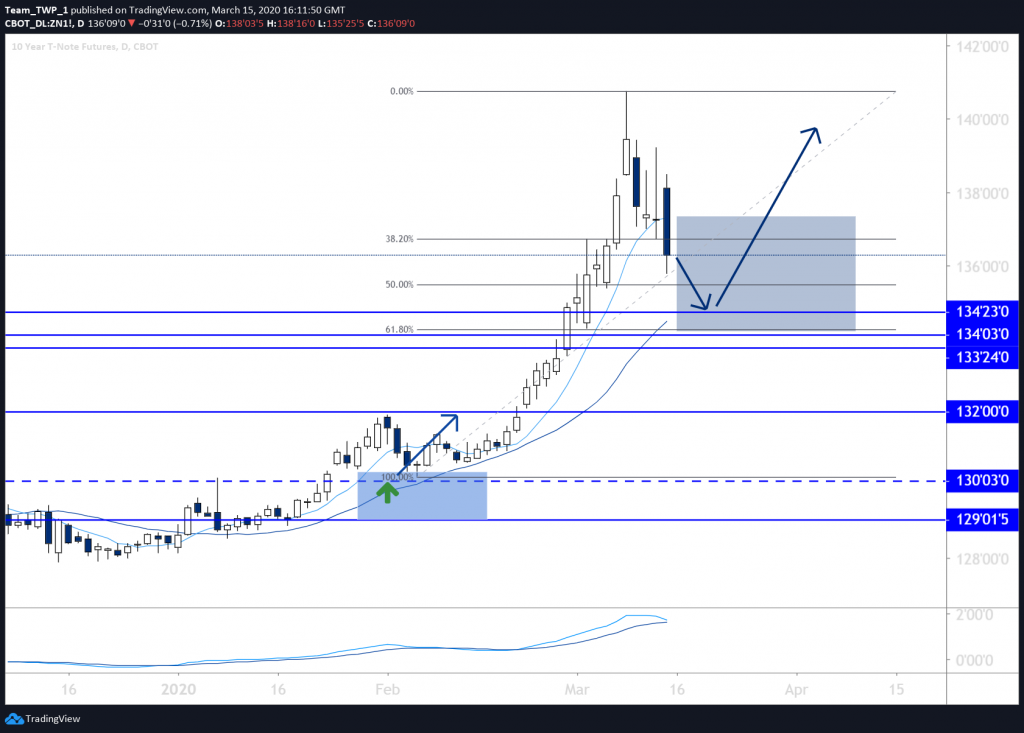
10-Year T-Note, Daily, Bullish
The late professor Benjamin Graham – who Warren Buffet has described as one of his most important investing influences – is widely considered to be the father of Value Investing. Graham recommended that investors should appropriate as much as 70 percent of their portfolio during Bull markets to stocks, with the remainder in Bonds. And he recommended that they should invert that weighting during Bear markets, so that the portfolio increases its exposure towards US Bonds to no more than 70 percent.
Technically, the Bond charts have been trending upwards on monthly, weekly and daily timeframes since early 2019, and may even be over-extended on the weekly and monthly charts. They have begun a daily retracement back down into the Moving Averages (MAs), and historical levels at 134’25, 134, and 133’25. A Fibonacci measurement places the 61.8 percent level in between 134 and 133’25. All three of these levels sit close to or between the MAs, which is an area of equilibrium.
Should price produce a bullish candlestick at one of these levels, it may be the bulls returning to start the next move up. An entry above the high of this bullish candlestick could provide an elegant entry, while a stop-loss below 133’25 could provide technical protection.
Also worth considering is that if price retraces deeply on the weekly timeframe and only finds support at 132 – the closest significant level for that timeframe – it could also offer a similar setup and trend entry opportunity.
Taking partial profits should the trade be triggered could mitigate risk as part of a trade and risk management plan.
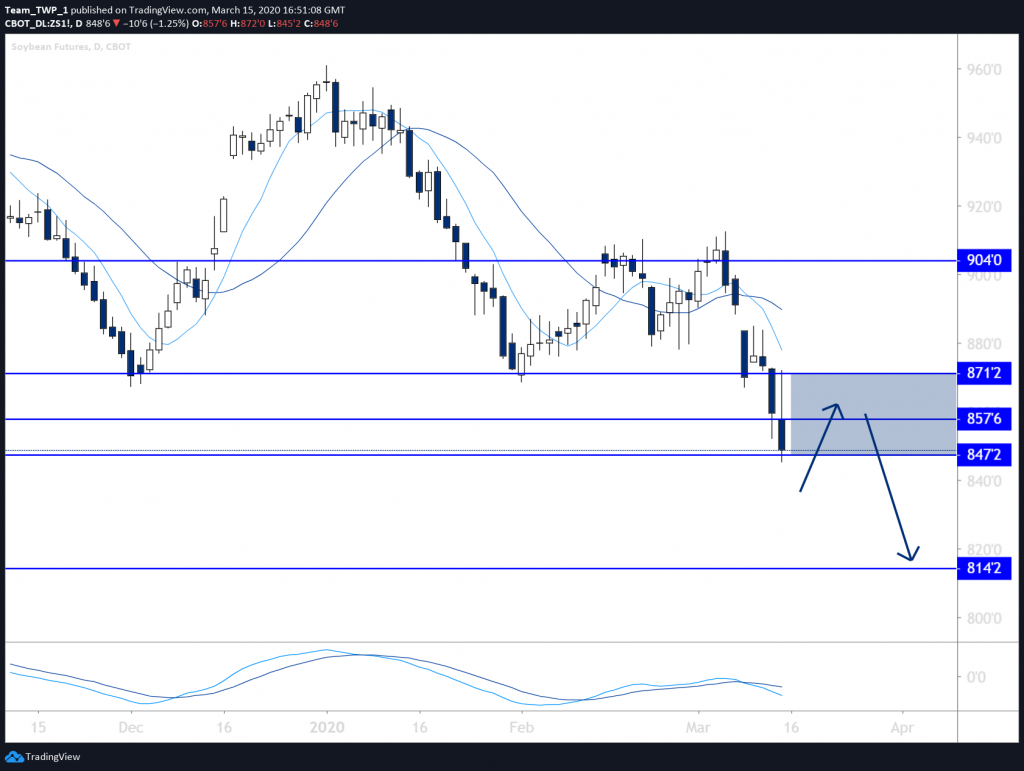
Soybean, Daily, Bearish
Soybean has a down-trending weekly and daily chart with lower-lows and lower-highs.
Price recently broke through historical support at 870 and could find its way back up during a future retracement to test this level, before resuming a downtrend.
There are also horizontal levels at 857 and 847 that could offer resistance. Should price retrace to these levels in this area and produce a small or medium-sized bearish candlestick, it may offer an entry to the trend if it resumes.
A stop-loss above the 870 level could offer additional technical protection.
Taking partial profits if price resumes and heads towards 814 or lower could mitigate risk further.
Risk management will be key, so a stop-loss is imperative, in order to protect capital exposure against unforeseen outcomes.