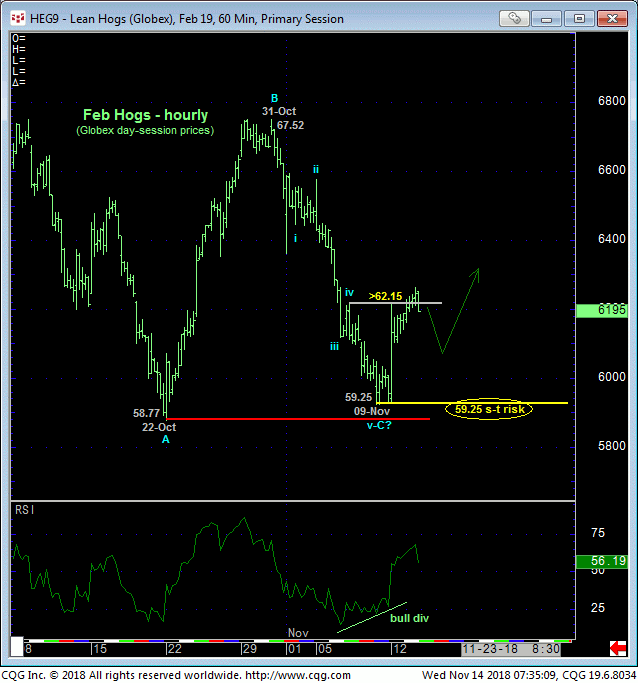
In 05-Nov’s Technical Webcast we discussed the combination of waning upside momentum from the extreme upper recesses of the past couple months’ range leaving the market vulnerable to a corrective relapse. A little more than a week on the reverse may be true following yesterday’s bullish divergence in short-term momentum in the soon-to-be-prompt Feb contract. The hourly chart below shows yesterday’s recovery above 07-Nov’s 62.15 minor corrective high that confirms a bullish divergence in short-term momentum. This mo failure leaves Fri’s 59.25 low in its wake as the END of what looks to be a nice 5-wave Elliott sequence down from Halloween’s 67.52 high. Per such we believe this 59.25 level serves well as an objective short-term risk parameter from which non-bearish decisions like short-covers and cautious bullish punts can now be objectively based and managed.
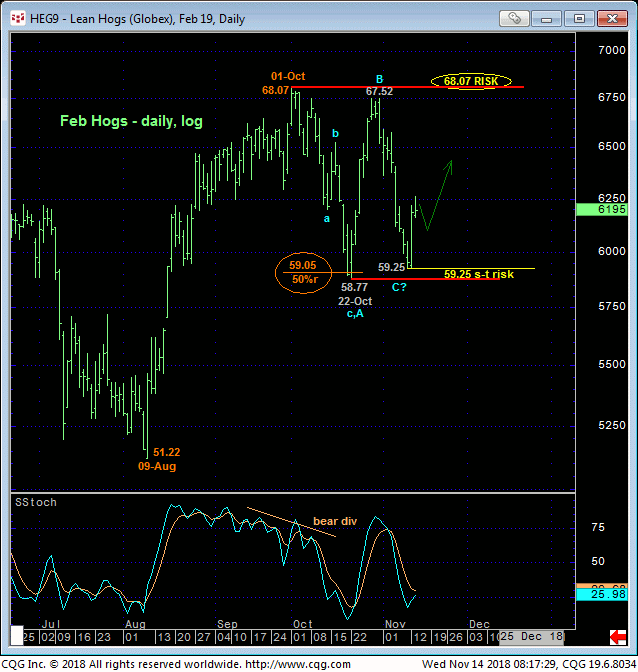
The fact that this admittedly smaller-degree momentum failure stems from the extreme lower recesses of the past month-and-a-half’s range and 50% retrace of Aug-Oct’s 51.22 – 68.07 rally in what thus far is only lateral chop from 01-Oct’s high warns that this price action may only be corrective/consolidative within a much broader bull trend to eventual new highs above 68.07. If, conversely, the market has something bearish in store, all it’s got to do is prove weakness below the 59.25-to-58.77-range.
Proof a labored, corrective behavior on relapse attempts in the days or even hours ahead would reinforce this bullish count as will continued trendy, impulsive behavior up through the 63-handle.

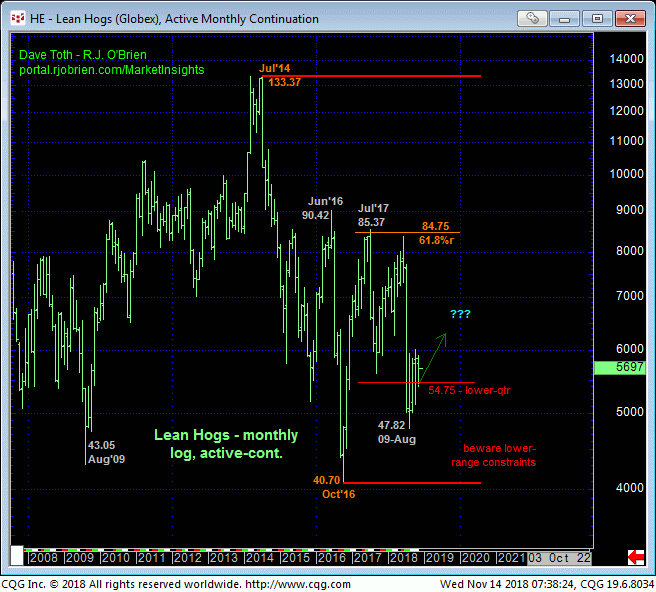
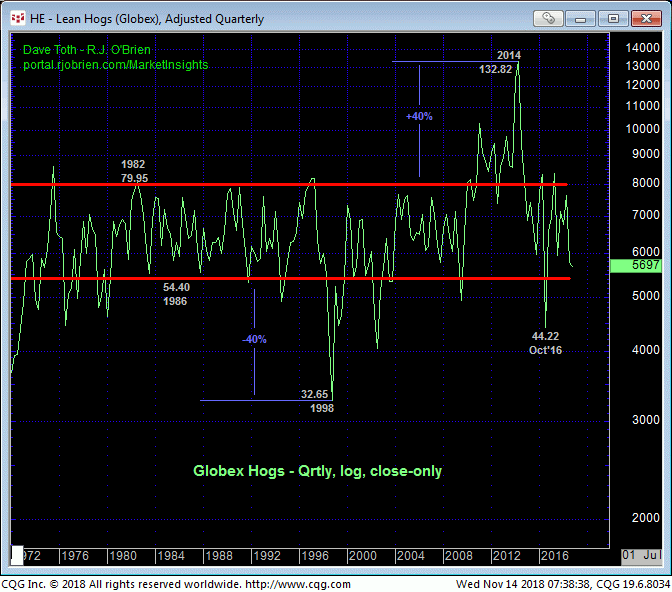
Traders are reminded that the prompt contracts have recently engaged and rejected the lower-quarter of the past 10-year range shown in the monthly log active-continuation chart above. And on an even broader quarterly log close-only basis below, the market has slipped back to the lower recesses of its historic mean range. From such levels we believe the front contracts like Feb and Apr, could remain vulnerable to more significant gains.
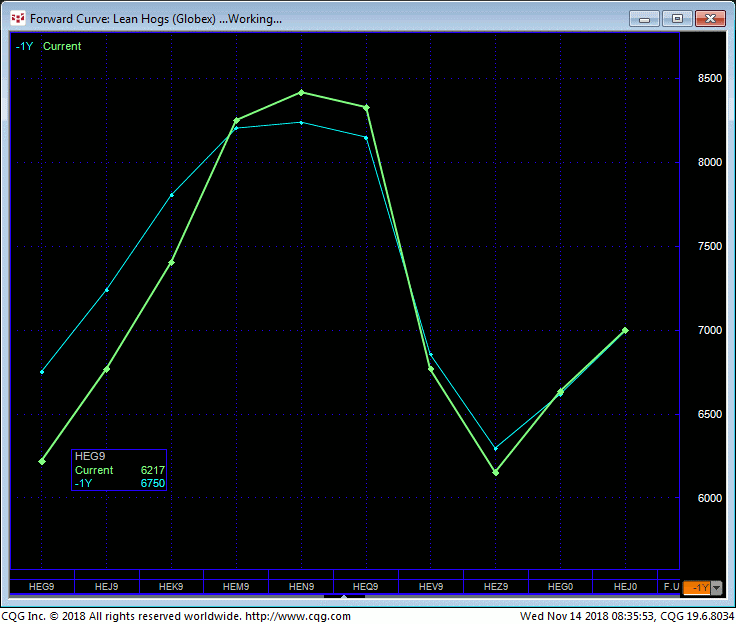
The forward curve below shows the typical yearly profile for hogs with mid-year contracts trading at premium prices. This year’s curve (light green line) is virtually identical to the curve that existed a year ago (light blue line).
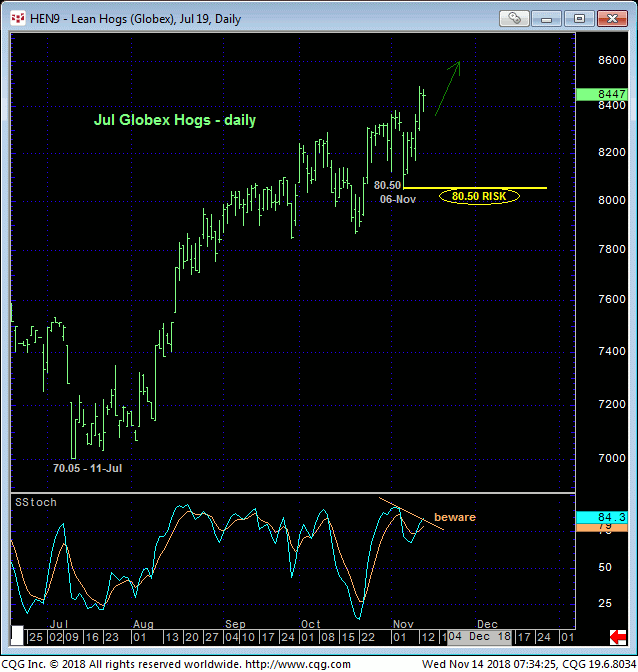
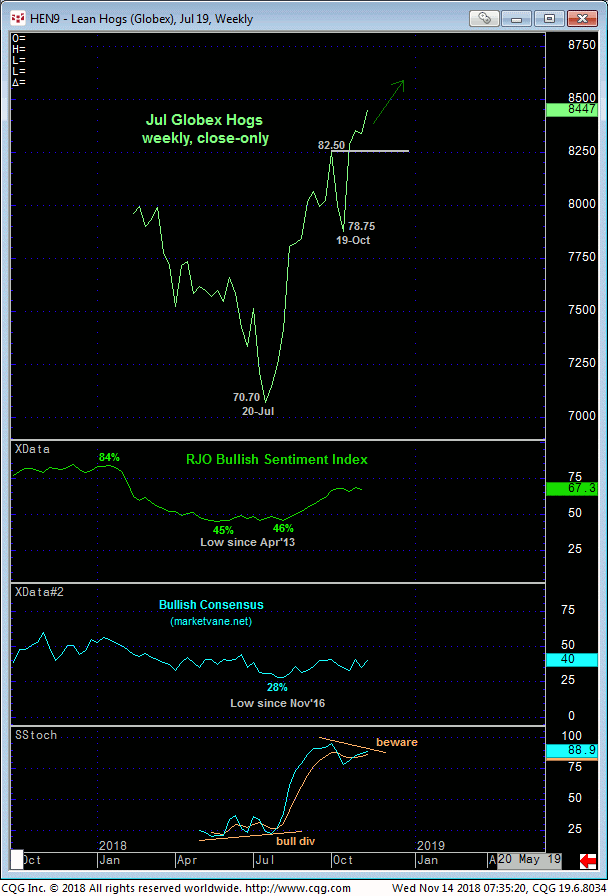
Looking at the Jul contract on a daily basis above, the uptrend is clear and present and is expected to continue and perhaps accelerate. The POTENTIAL for a bearish divergence in developing nicely, but a failure below 06-Nov’s 80.50 corrective low is required to CONFIRM the divergence to the point of non-bullish action like long-covers and subsequent new bearish punts after rebound attempts.
These issues considered, traders are advised to first approach a relapse against this week’s rebound to the 60.95-to-60.55-range as a corrective buying opportunity with a failure below 59.25 required to negate this call. Subsequent resumed strength above 62.62 will reinforce this call that warns of a return to the upper recesses of the recent range and quite possibly a resumption of Aug-Oct’s uptrend to new highs above 68.07.
