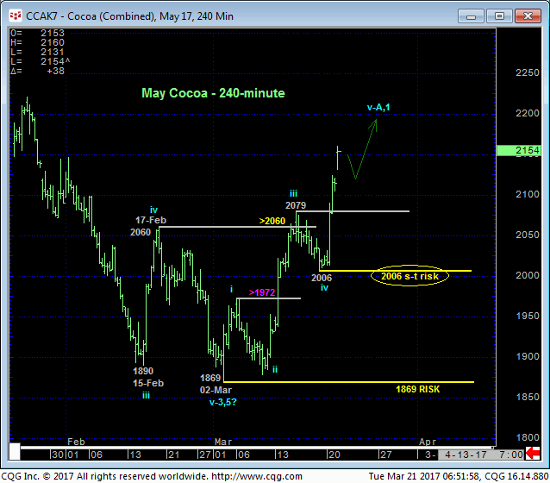
In 14-Mar’s Technical Blog we alluded to the developing potential for a base/reversal-threat environment after an admittedly micro momentum failure above 06-Mar’s 1972 smaller-degree corrective high. Subsequent strength above at least 17-Feb’s 2060 corrective high and preferably 01-Feb’s 2150 larger-degree corrective high remained required however to really threaten and then break the major downtrend given the magnitude of the collapse from Apr’16’s 3240 high. The 240-min chart below shows that this subsequent strength unfolded later in the day on 14-Mar and then overnight with continued gains above that key risk parameter at 2150.
As a direct result of this week’s continued gains the 240-min chart below shows that the market has identified Fri’s 2006 low as the latest smaller-degree corrective low that the market now needs to sustain gains above to maintain a more immediate bullish count. In this regard 2006 is considered our new short-term risk parameter from which non-bearish decisions like short-covers and cautious bullish punts can be objectively based and managed. This and perhaps a subsequent shorter-term risk parameter will come in handy as the initial counter-trend recovery against a secular bear trend typically experiences a corrective retest of the low that can be extensive in terms of both price and time. And it would be around such a smaller-degree corrective low and short-term risk parameter that such a relapse can be more objectively and safely navigated.


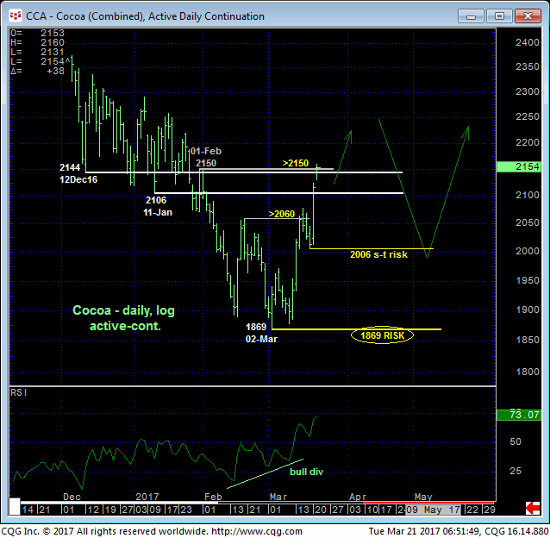
The daily log scale chart above shows the market’s failure to sustain Feb-Mar losses below a ton of former support from the 2144-to-2106-range from Dec-Jan that should have survived as new resistance if the market was still truly weak. This week’s recovery above this area in general and above 01-Feb’s 2150 corrective high and key risk parameter specifically breaks the major downtrend and confirms 02-Mar’s 1869 low as one of developing importance and our new key risk parameter from which to objectively navigate a major correction or reversal higher.
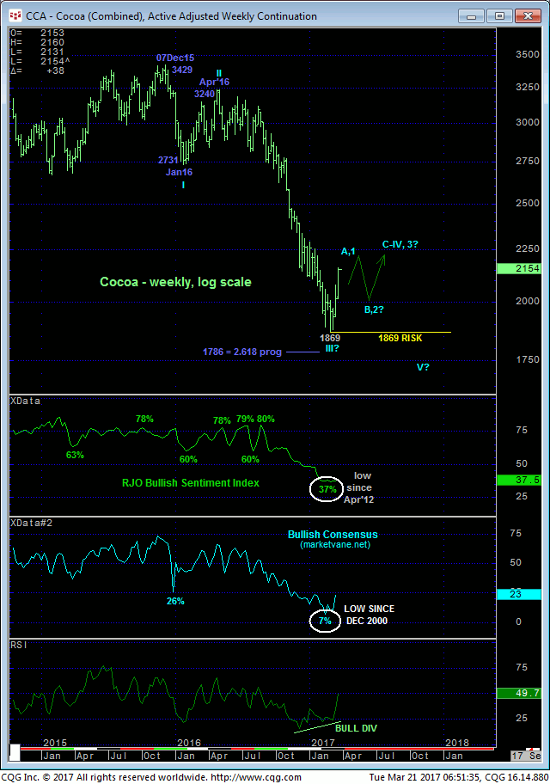
The weekly log scale active-continuation chart below shows the very unique combination of:
- a confirmed bullish divergence in momentum that, in fact, breaks the major downtrend amidst
- historically bearish levels of market sentiment
that is typical of major base/reversal environments. Indeed, while the recent 37% reading in our RJO Bullish Sentiment Index is the lowest in five years, mid-Feb’s 7% reading in the Bullish Consensus (marketvane.net) is the lowest in over 16 YEARS! Such gross bearish sentiment is typical of major BASE/reversal PROCESSES. It’s important to acknowledge however that sometimes this condition only sets up the interim (4th-Wave) correction as part of the major slowdown process that precedes a (5th-Wave) plunge to one final round of new lows as part of that base/reversal process. Per such, it would be premature to conclude 02-Mar’s 1869 low as the end of the secular bear trend at this early time, as opposed to just the end of a massive 3rd-Wave that has now given way to a major (4th-Wave) correction/consolidation event. But given the magnitude of 2016’s meltdown, even this correction could be major in scope and span months and expose a “pop” to 2300 or higher.

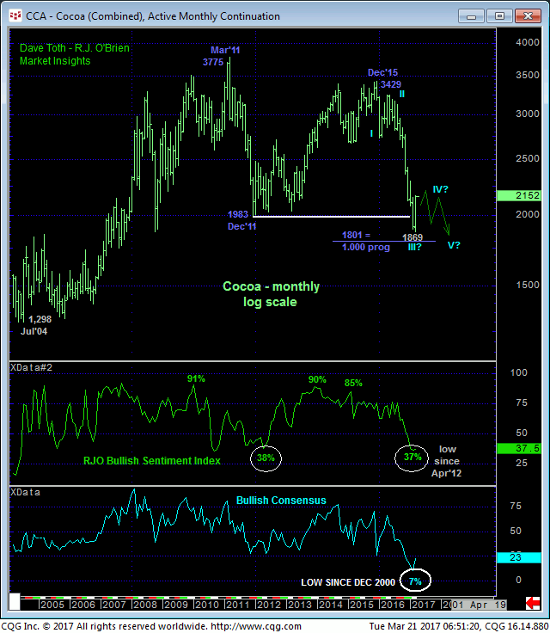
When the market posted a 1983 low in Dec’11, the monthly log scale chart below shows that the major bottoming process that followed included a near-50% retracement of the prior 2011 collapse and nearly TWO YEARS of lateral chop and a severe retest of the 1983 low before the next major bull truly took hold in Sep-Oct’13. The point here is that following major trends- down in this case- it’s typically a very poor and risky endeavor to “chase” the initial counter-trend rally. Preferably, traders are advised to, first, neutralize all previous bearish exposure (which we’ve done) and be watchful for a bearish divergence in momentum needed to stem the initial counter-trend rally and prepare for what could be an extensive corrective setback before considering a new long-term bullish policy. And often times that bearish divergence in mo following the initial counter-trend spasm offers a terrific risk/reward sale; so while we believe a major correction or reversal higher has begun that ultimately warrants a bullish policy, the next favorable risk/reward play could still come from the bear side.
In sum, we believe the major bear market has stalled or ended, exposing either a major correction or reversal higher. All previously recommended bearish exposure and policy has been nullified and traders are advised to maintain a neutral/sideline position for the time being. We will be watchful for a bearish divergence in momentum that could signal the end of this initial counter-trend pop and provide an interim favorable risk/reward play from the bear side. Until such a mo failure stems the current rally however, the market’s immediate upside potential is indeterminable and potentially steep.


